Nutrients are essential for life but create problems for lakes when in excess.
Nutrients, including nitrogen and phosphorus, are a natural part of all ecosystems, are essential for all forms of life, and have been delivered to Lake Champlain by natural processes for millennia. In the post-industrial era, however, human activities have rapidly increased the rate of nitrogen and phosphorus delivery to Lake Champlain and to thousands of waterbodies around the world, with profound effects on freshwater systems.
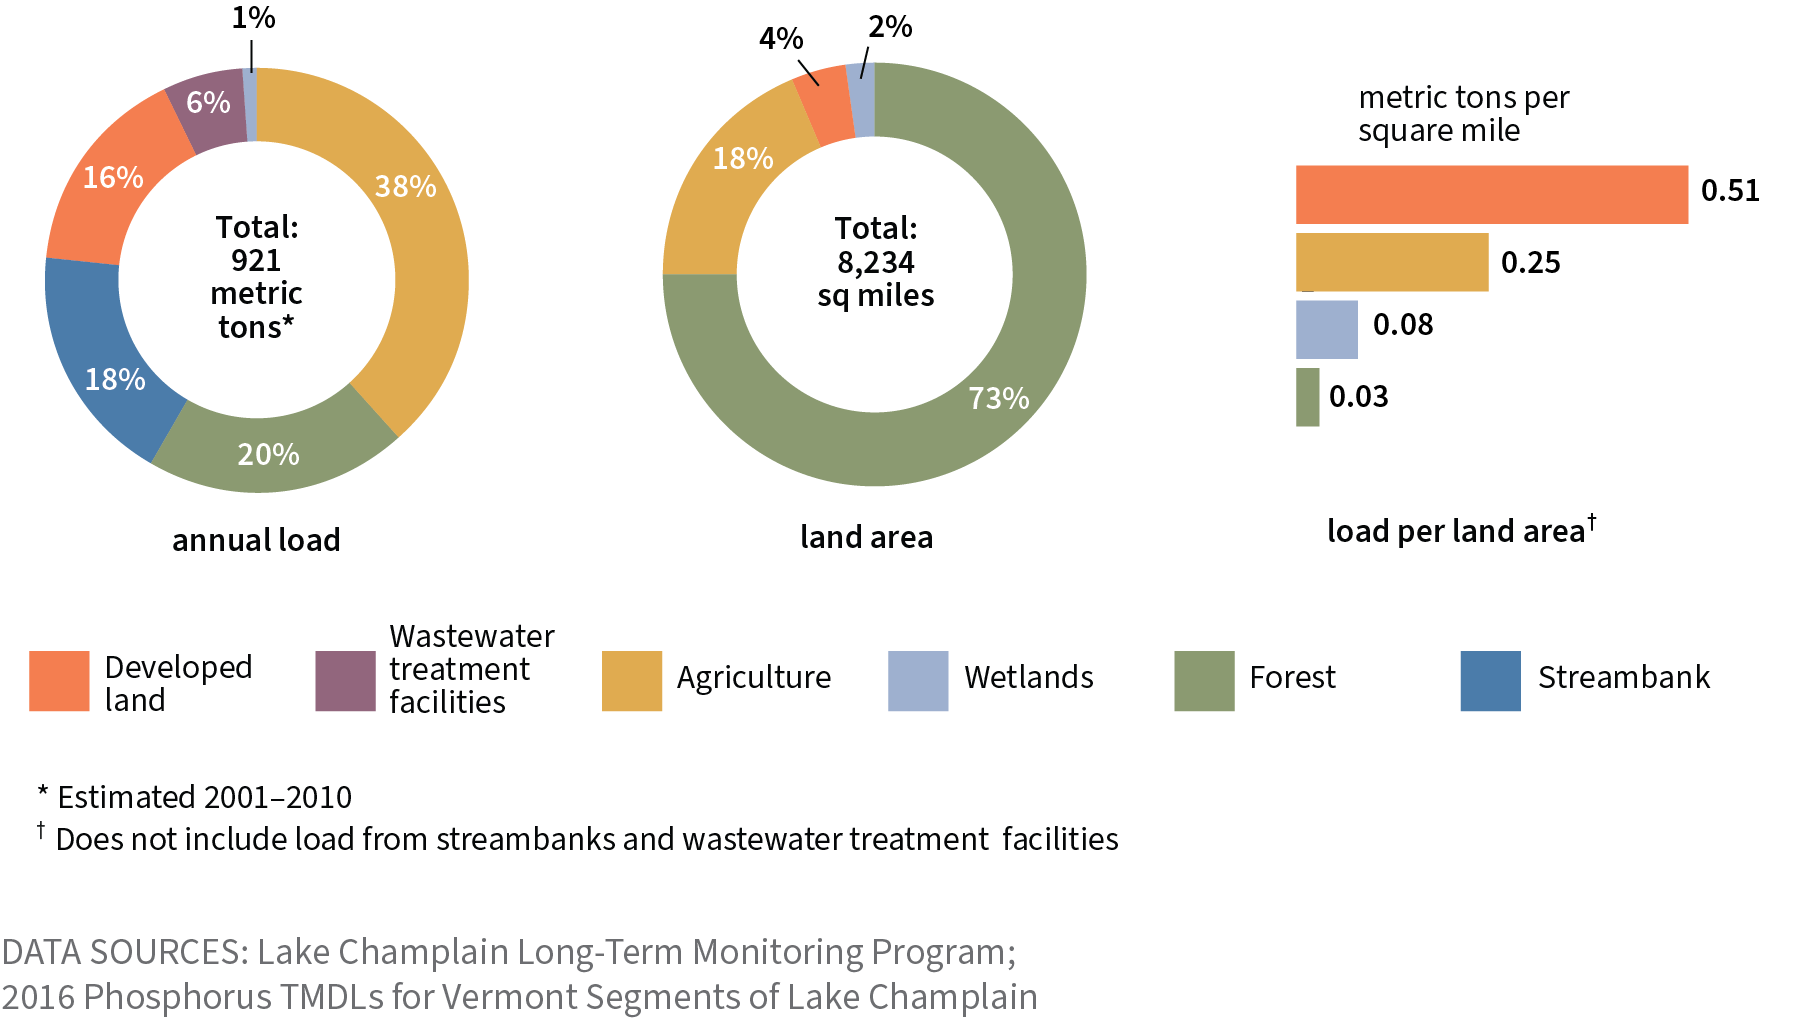
For every square mile on the surface of Lake Champlain, 18 square miles of land in the Lake Champlain Basin deliver water to the Lake and contribute sediment, nutrients, and other potential pollutants. For the Great Lakes, this ratio is much lower: there is only 1.5 to 3.4 times as much land as lake surface area in those basins. Most nutrients come from sources on the land (Figure 5), so the relatively high land-to-lake area ratio for Lake Champlain poses a significant challenge in limiting nutrient pollution.
Figure 5 | Annual phosphorus loading to Lake Champlain by land cover
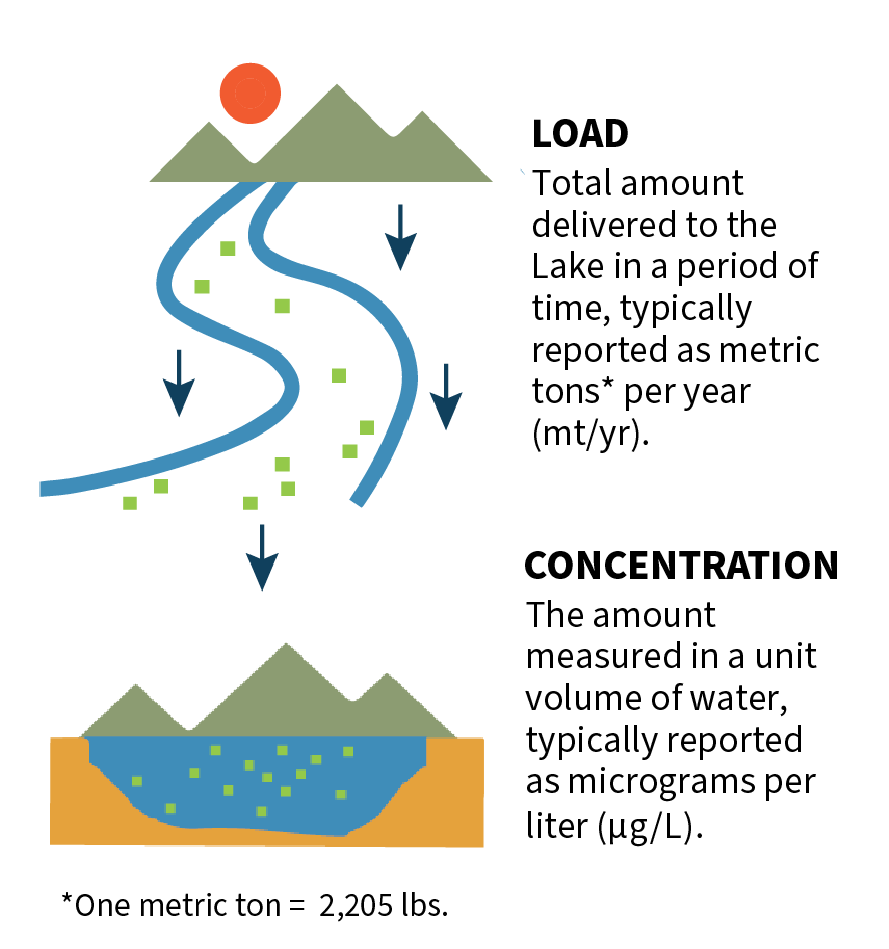
Rivers are the pathways for water, sediment, and nutrients to move into Lake Champlain. Each year, the Lake’s tributaries deliver about 921 metric tons (roughly 2 million pounds) of phosphorus. Annual changes in phosphorus delivery to the Lake depend upon the amount of rain and runoff in the watershed; this variability due to precipitation and temperature may confound efforts to reduce phosphorus loading. While management practices may help to reduce inputs, the increasingly intense rainstorms associated with climate change may release more phosphorus, possibly canceling out some gains made through pollution-reduction efforts.
Research has shown that the primary drivers of annual in-lake nitrogen and phosphorus levels differ for shallow and deep regions of Lake Champlain. In deep regions, these nutrient levels are driven by tributary inputs of “dissolved” nitrogen and phosphorus—forms that are not bound to larger sediments and that are small enough to be invisible in the water. In shallow regions, nutrient levels are driven by internal processes such as biological transformations of nitrogen and legacy phosphorus released from lake-bottom sediments and are less impacted by year-to-year changes in river loading. In the long term, reducing tributary loading is the only way to reduce nutrient levels in Lake Champlain.
Phosphorus is a key nutrient driving cyanobacteria blooms.
Photosynthesizing plants, algae, and cyanobacteria all require a supply of carbon, nitrogen, phosphorus, and light in their environment to grow. Because other nutrients are generally plentiful in Lake Champlain, phosphorus is often the resource that limits growth of cyanobacteria. In order to reduce the occurrence and persistence of cyanobacteria blooms, lake managers have set targeted limits on phosphorus concentrations for each segment of the Lake and work to reduce the loading of phosphorus to the Lake from tributaries.
Many Lake segments have phosphorus concentrations that are often near or below targeted limits. However, phosphorus concentrations in Lake Champlain’s shallow bays are often above these limits.
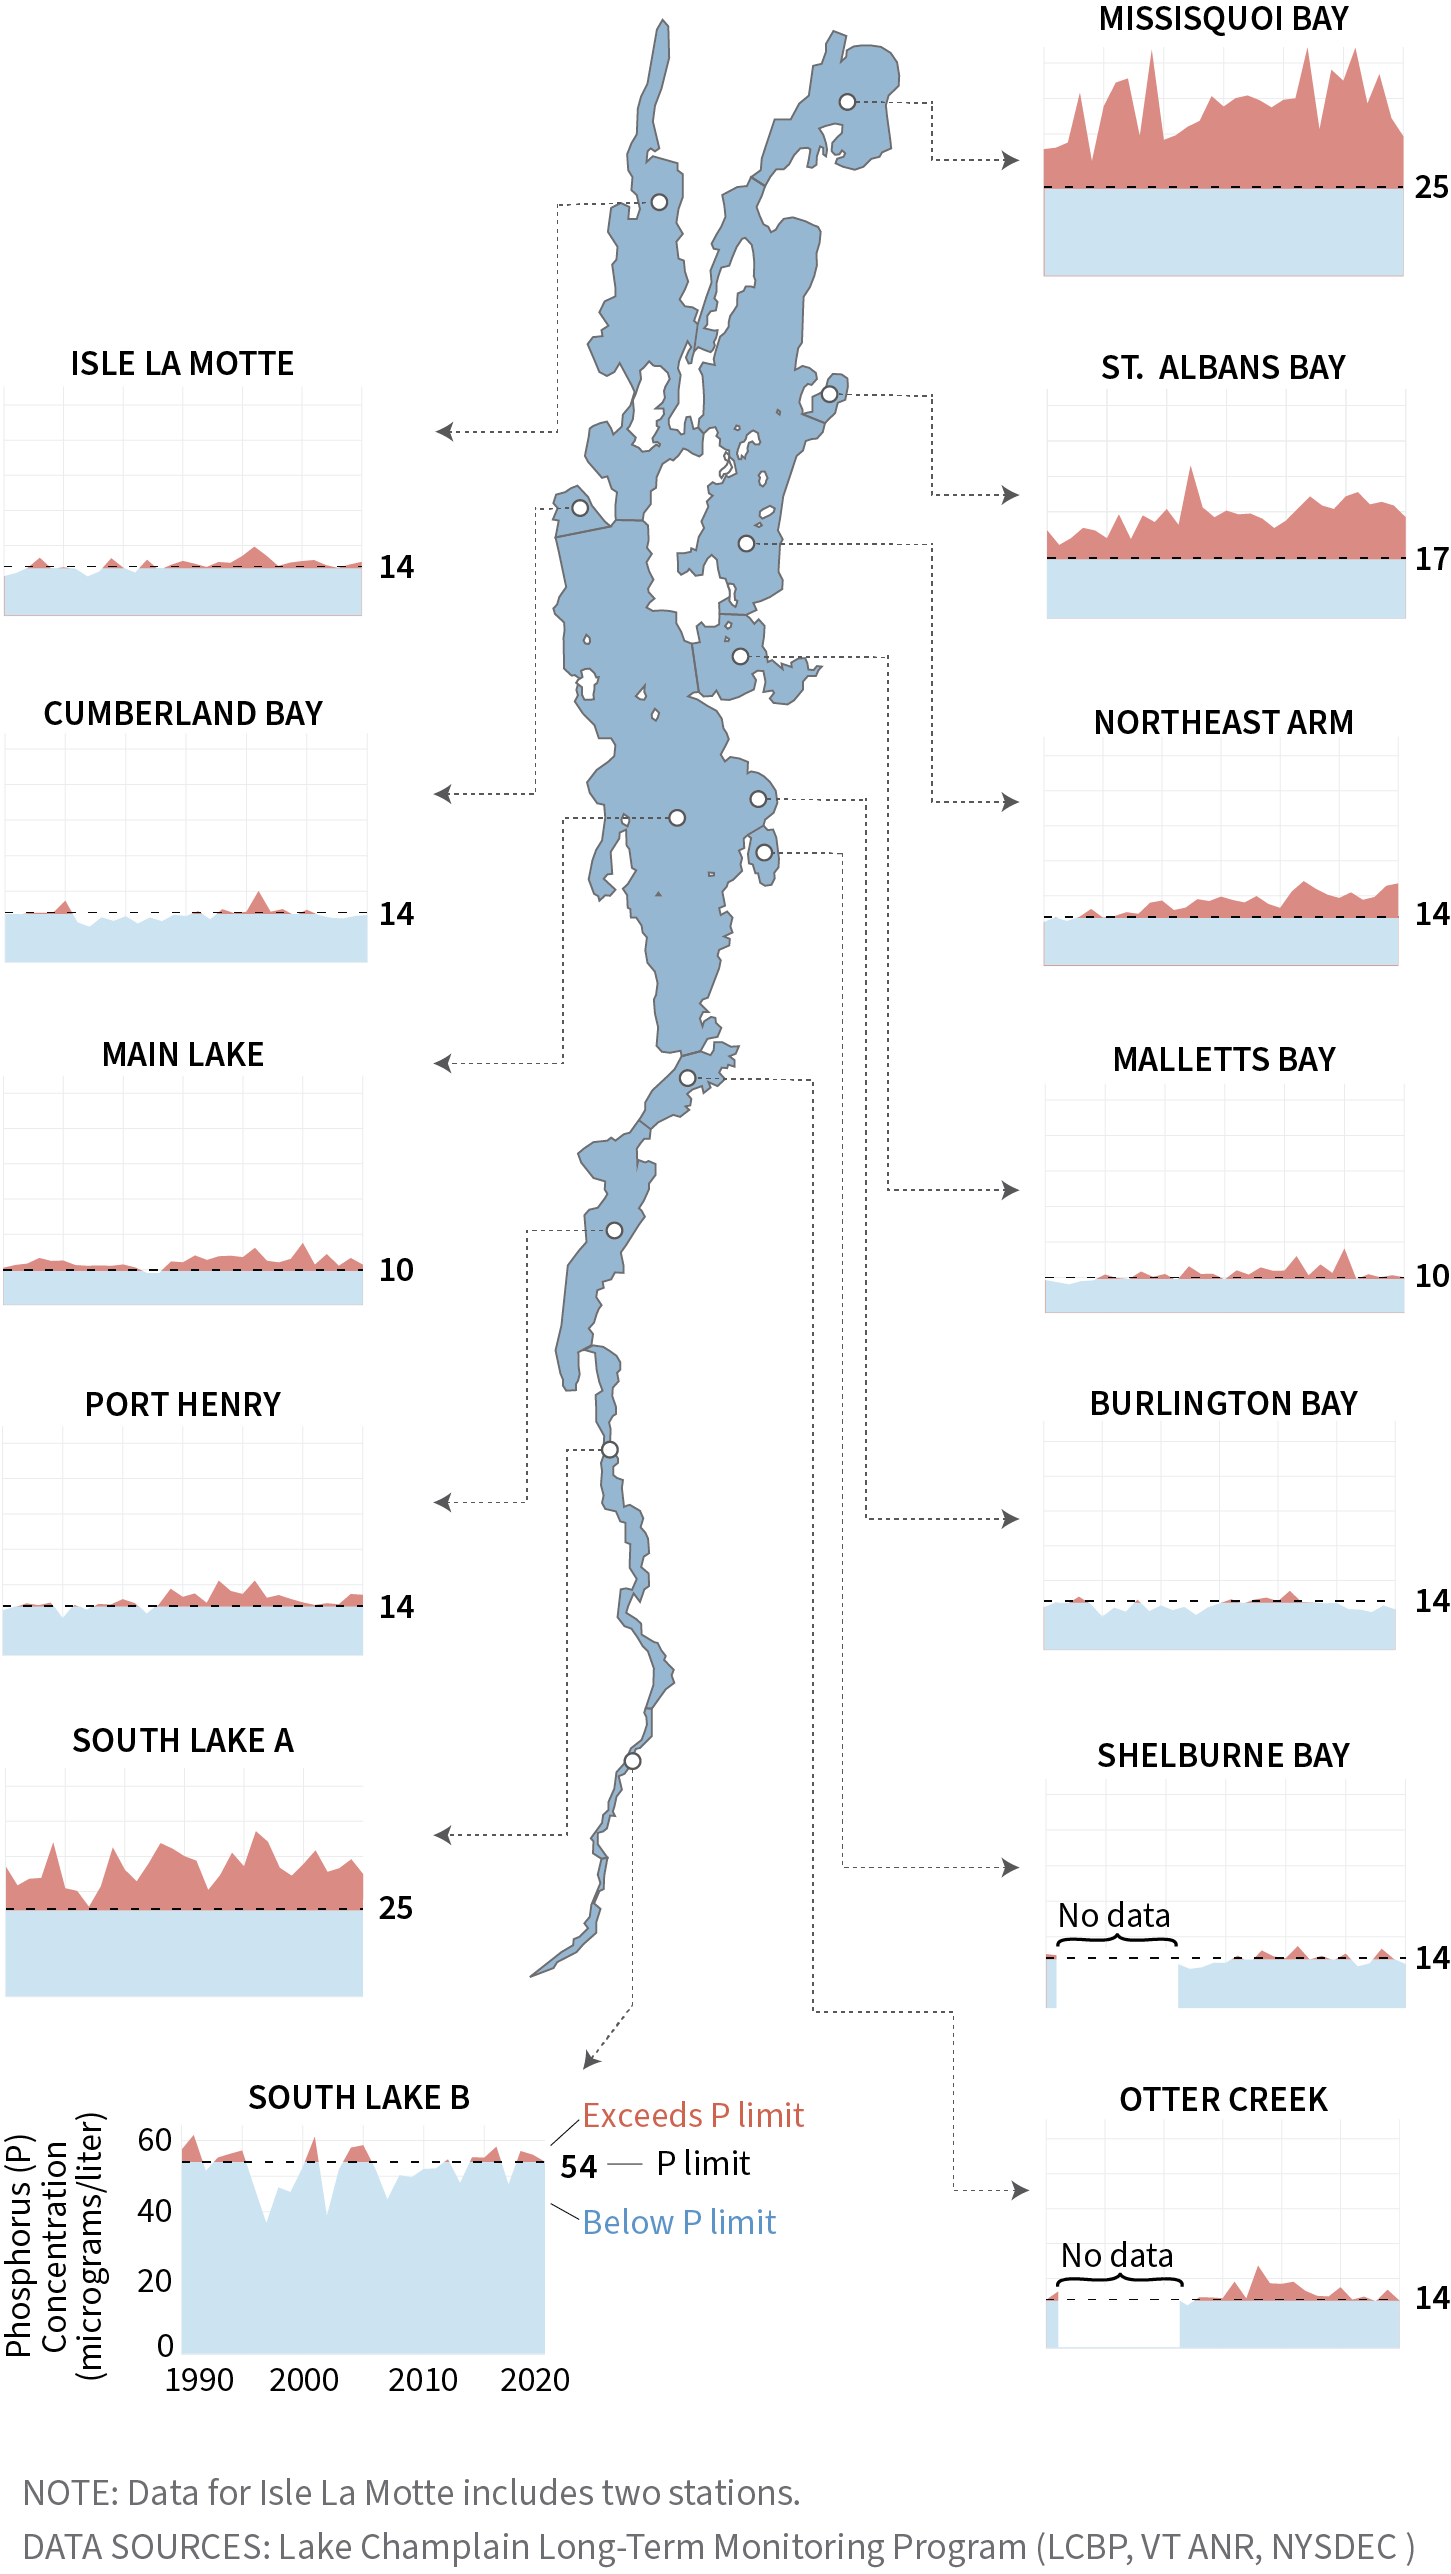
Excessive phosphorus has a significant impact on a lake’s ecosystem and is a contributing cause of cyanobacteria blooms. Phosphorus concentration limits for 13 segments of Lake Champlain (Figure 6) were established in 1991, and the LCBP has supported monitoring efforts for phosphorus concentrations in the Lake since 1990. From 1990 to 2020, most segments did not show long-term trends in phosphorus concentration, though the Northeast Arm showed an increasing trend over this time period. Annual average concentrations often have been near or below targeted limits since 1990 in the Main Lake, Isle La Motte segment, Cumberland Bay, Port Henry, South Lake B segment, Malletts Bay, Burlington Bay, and Shelburne Bay, which together make up approximately 82% of Lake Champlain’s volume.
Figure 6 | Annual average phosphorus concentration by Lake segment
Phosphorus concentrations above established limits have been observed in the shallow waters of Missisquoi and St. Albans Bays, the South Lake A segment, and also in the deeper Northeast Arm segment. Some of these areas have high phosphorus loads from their contributing sub-watersheds. Also, shallow bays are more susceptible to problems associated with excess phosphorus than the deeper bays and Main Lake because there is less water to dilute nutrients. Shallow bays are also more affected by “legacy phosphorus” that is released from bottom sediments into the water column during low-oxygen conditions.
Phosphorus loading to Lake Champlain varies greatly from year to year and generally needs to be reduced to meet water quality goals.
Phosphorus loading has remained a challenge for Lake Champlain, and long-term trends have not improved in most tributaries. Although long-term decreases have been documented in the Great Chazy, Salmon, Ausable, Little Ausable, LaPlatte, and Pike Rivers, long-term increases in phosphorus loading have been documented in Lewis, Otter, and Little Otter Creeks and in the Missisquoi and Poultney Rivers. All other monitored tributaries show no significant long-term trends in phosphorus loading.
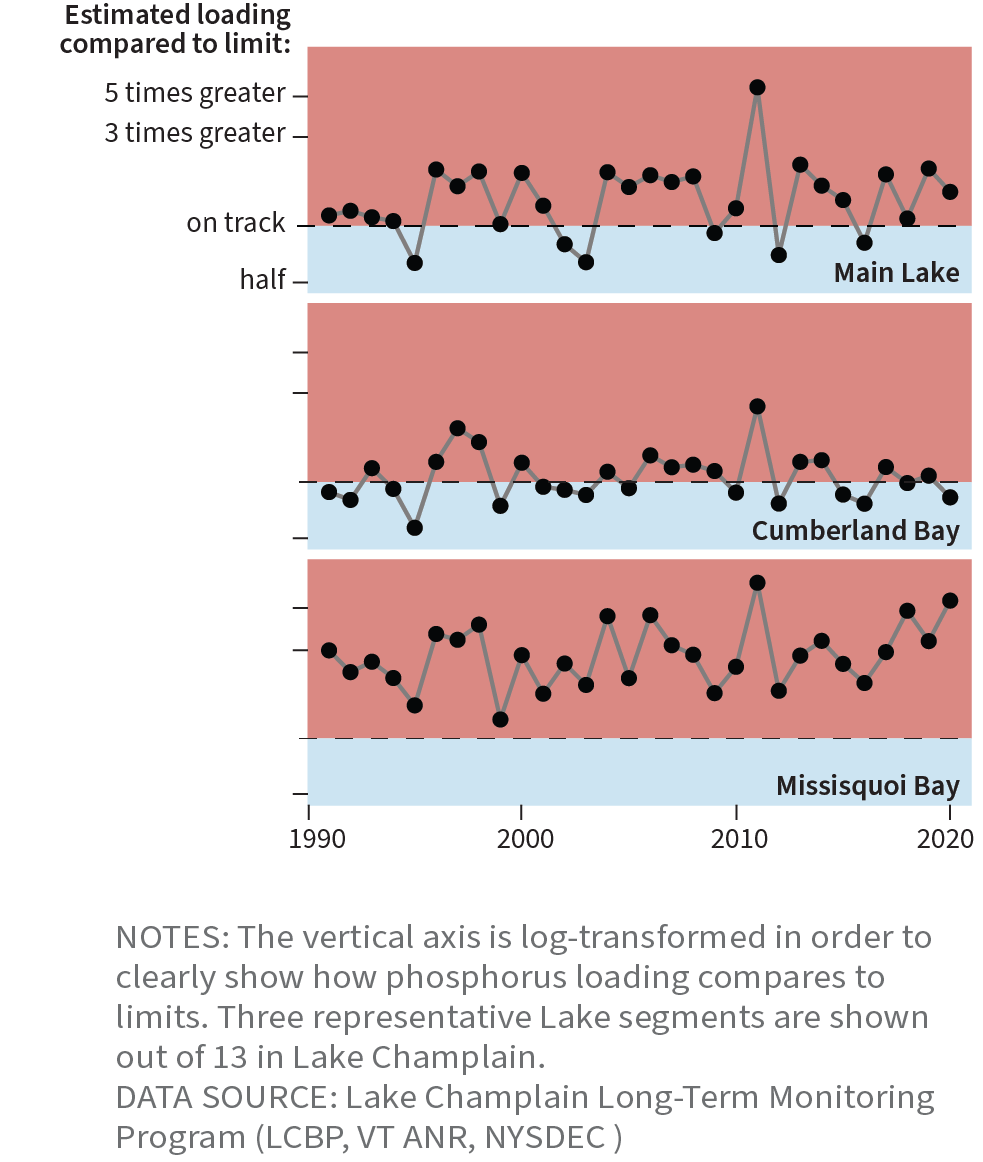
Figure 7 | Phosphorus loading to Lake segments compared to TMDL limits
In 2016, the U.S. Environmental Protection Agency produced an updated Vermont Total Maximum Daily Load (TMDL) for phosphorus loading into 12 Vermont segments of Lake Champlain while New York continues to work toward the TMDL set in 2002 for New York segments of the watershed. Phosphorus loading to some Lake segments, such as Cumberland Bay, has been at or below these limits; phosphorus loading to other segments, such as Missisquoi Bay, has been well above limits (Figure 7). Because nutrients and sediment are primarily transported to the Lake during periods of high river flows, phosphorus loading is strongly influenced by annual differences in snowpack, rainfall, and periods of drought. This year-to-year variability in loading is likely to continue and may increase as a result of changing precipitation patterns due to climate change. This means that reducing the average annual phosphorus loading is critical for the future of Lake Champlain’s water quality.
Many efforts are underway to reduce phosphorus loading and ultimately reduce phosphorus concentrations in Lake Champlain.
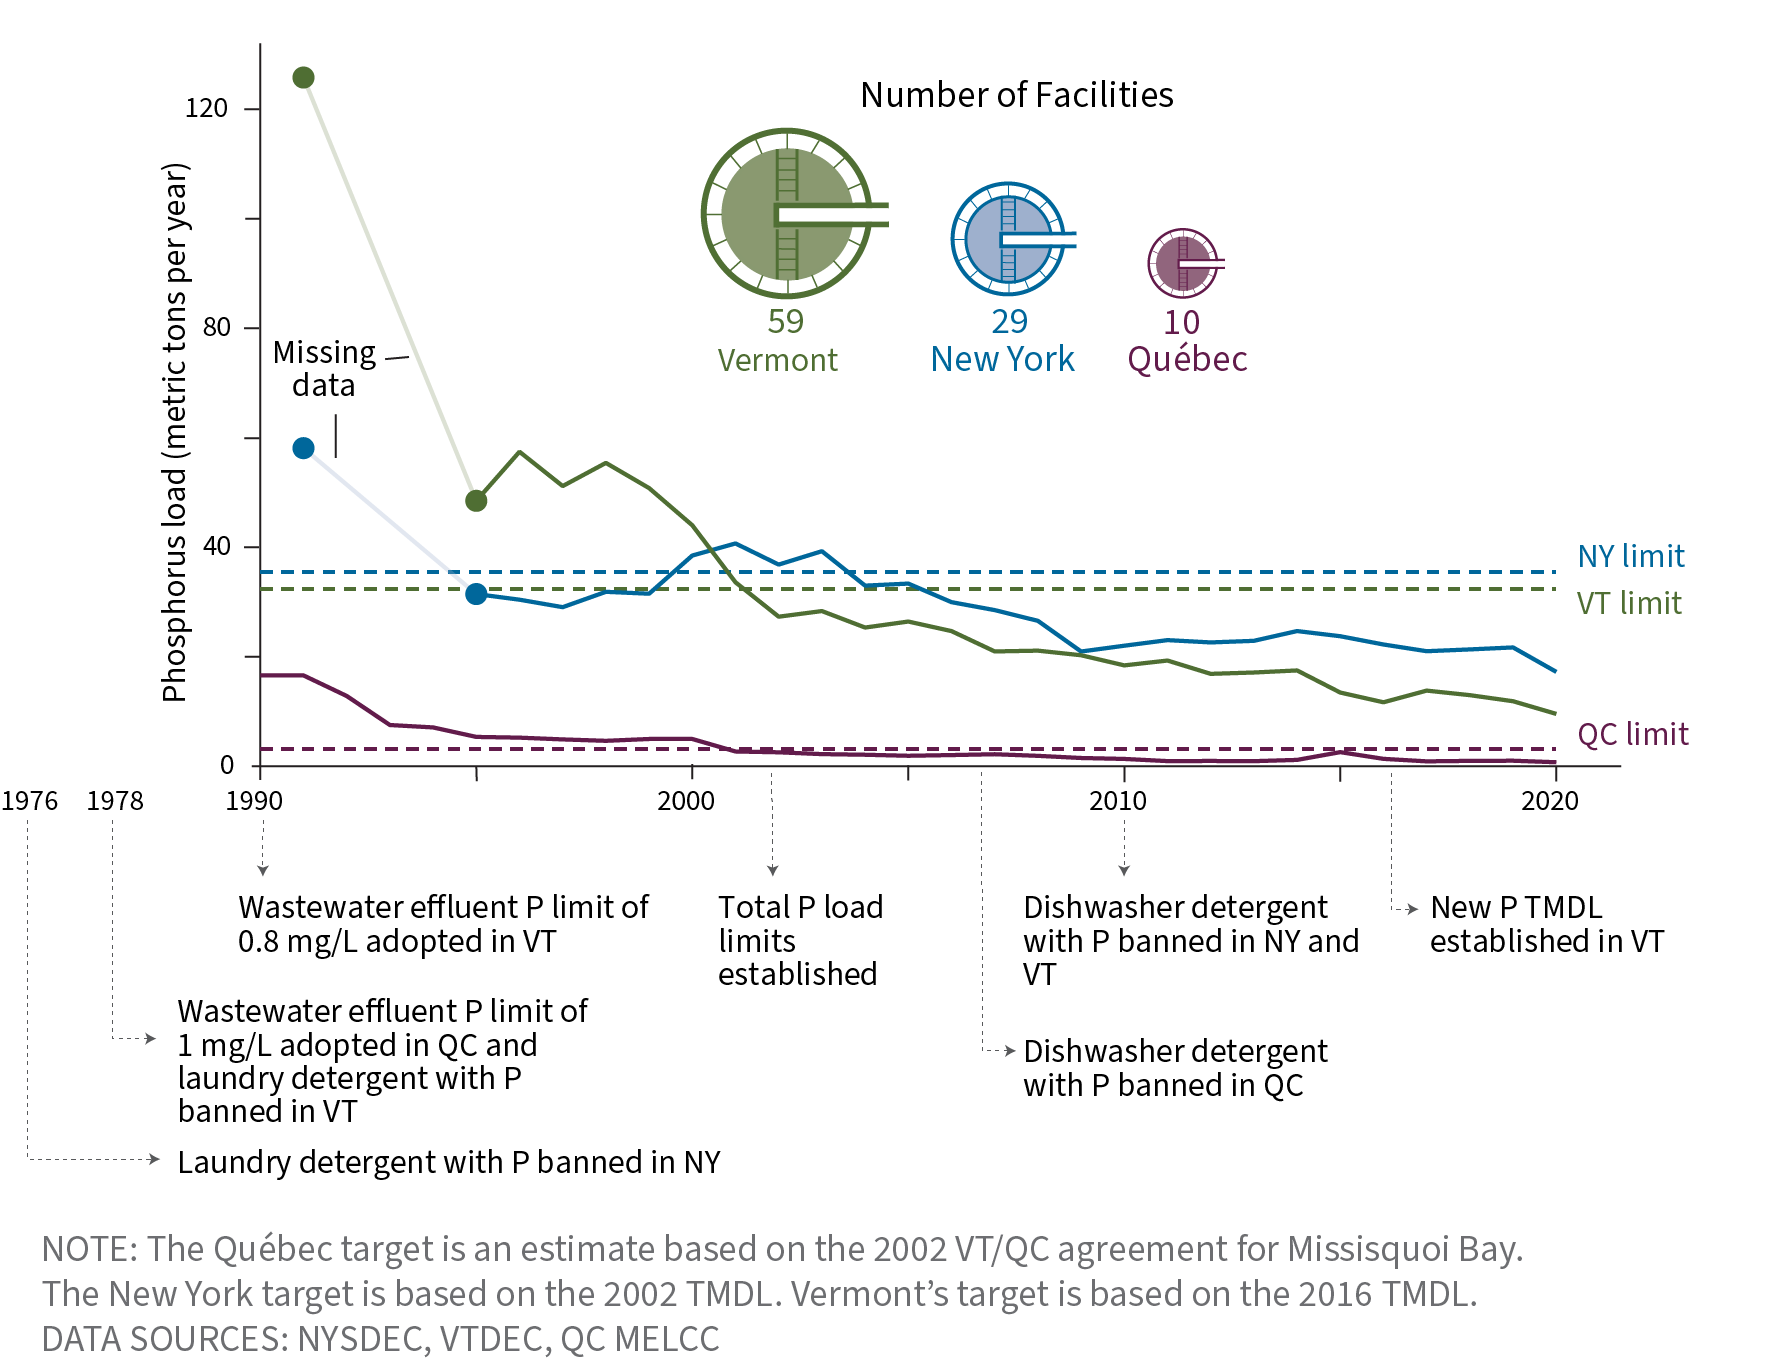
Lake Champlain has been the focus of renewed investments in watershed management practices by the U.S. federal government, state and provincial agencies, and municipalities. Recent investments in wastewater treatment facilities have driven significant reductions in phosphorus loading from these sources in all three jurisdictions (Figure 8). In 2015, the Vermont legislature passed the Clean Water Act (Act 64), which established several new rules and established revenue requirements for the Vermont Clean Water Fund to reduce the amount of phosphorus and other pollution entering the state’s waterways. Vermont and Québec adopted an agreement concerning phosphorus reduction in Missisquoi Bay in 2002. The agreement reaffirmed the phosphorus concentration limit for the bay and established a phosphorus loading limit for the bay’s watershed. The two jurisdictions recently renewed the agreement and shared common goals for the restoration of Missisquoi Bay.
Figure 8 | Annual phosphorus load from wastewater treatment facilities by jurisdiction
Farmers, resource management agencies, and local watershed organizations have long recognized that farms in the Basin play a significant role in nutrient pollution challenges. Several initiatives are underway to help the agricultural sector in meeting targeted phosphorus loading limits and ultimately reducing in-lake phosphorus concentrations. Ongoing grant programs, wastewater treatment upgrades, agricultural support to implement best management practices, and outreach programs all contribute to the reduction of phosphorus loading.
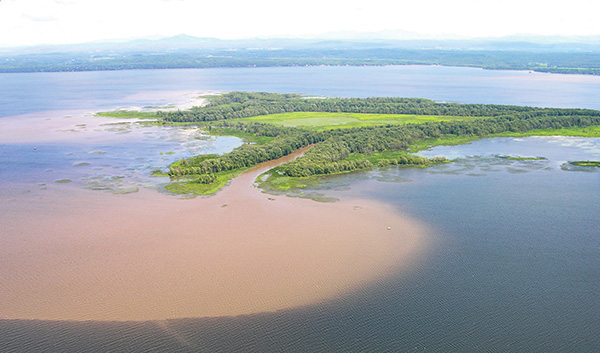
Sediment plume at the Missisquoi River delta. Photo: LCBP
The relative amounts of nitrogen and phosphorus in lake water can influence cyanobacteria blooms, and several factors are changing the balance of these nutrients in Lake Champlain.
Although it usually is not the primary driver of cyanobacteria growth, nitrogen is another key nutrient that has important influence over ecosystems and can impact how cyanobacteria blooms are established. Many species of cyanobacteria have the remarkable ability to capture their own nitrogen from the atmosphere. This means that when the in-lake balance of nitrogen and phosphorus is tilted toward relatively less nitrogen, cyanobacteria can sometimes outcompete other phytoplankton growing in the water and may be more likely to develop into bloom conditions.
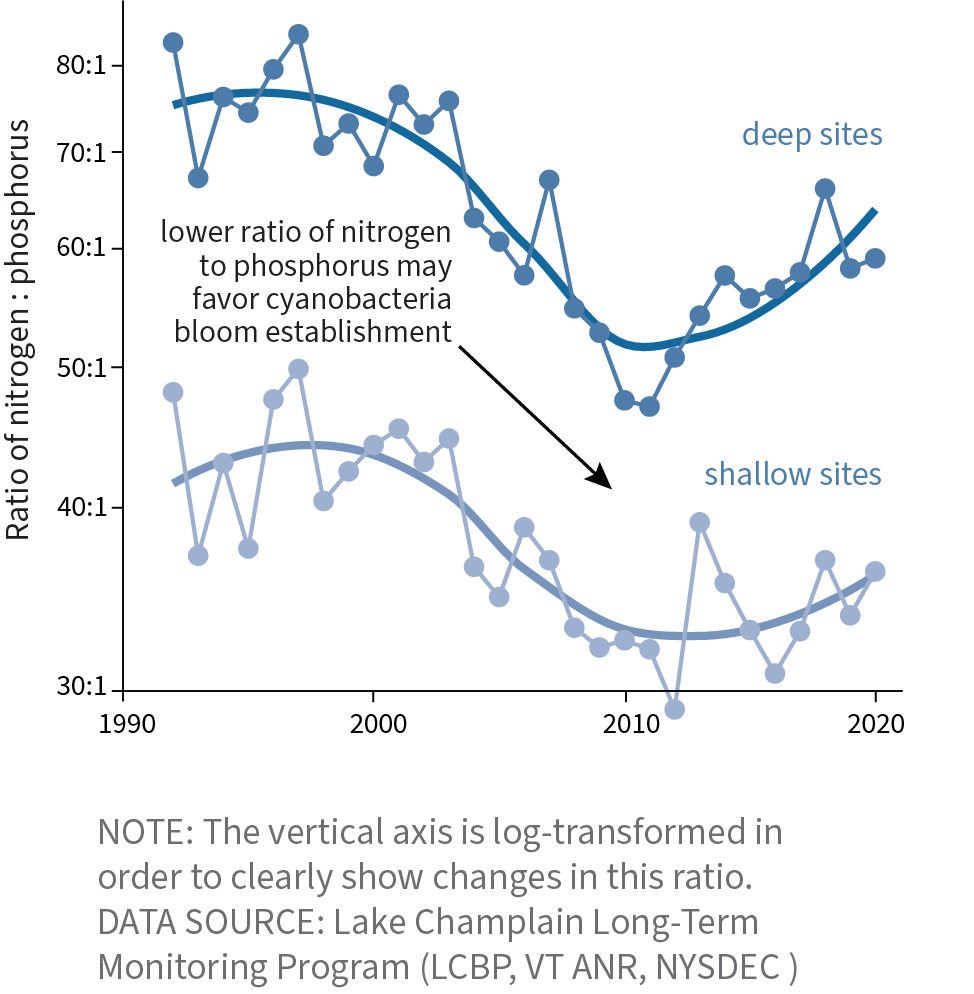
There has been a Lake-wide decrease in nitrogen concentration since monitoring began in 1990, which is likely driven by decreases in nitrogen inputs from fossil fuel emissions following the implementation of the U.S. Clean Air Act. This decline contributes to changes in the relative balance of nitrogen and phosphorus in the Lake (Figure 9).
Figure 9 | Annual average ratio of nitrogen to phosphorus in Lake Champlain
What You Can Do
Test your soil. To reduce nutrient runoff from your property, test lawn and garden soil to determine the nutrients the soil needs to support your plants before using fertilizer. It may be possible to use less fertilizer than you think or none at all.
Foster healthy soil. Improve soil health in your lawn and garden rather than relying on lawn care products that import nutrients into waterways. Adding compost and increasing aeration can help build healthy soil.
Raise the blade. Set your lawn mower blade to 3 inches, and leave grass clippings on the lawn. Tall grass is healthier and has deeper roots that hold more water, reducing stormwater runoff.
Reduce runoff. Try simple ways to reduce stormwater runoff around your home. Redirect your gutter downspouts to a lawn, plant a rain garden, or install a rain barrel.
Wash your car on the lawn. Wash your vehicle on a lawn instead of a driveway to prevent detergents from running into waterways. Or use a car wash where the water is treated after use.
Create natural buffers. Protect and plant native vegetation, especially along shorelines and riverbanks to hold soil in place and reduce erosion.

 Research has shown that the primary drivers of annual in-lake nitrogen and phosphorus levels differ for shallow and deep regions of Lake Champlain. In deep regions, these nutrient levels are driven by tributary inputs of “dissolved” nitrogen and phosphorus—forms that are not bound to larger sediments and that are small enough to be invisible in the water. In shallow regions, nutrient levels are driven by internal processes such as biological transformations of nitrogen and legacy phosphorus released from lake-bottom sediments and are less impacted by year-to-year changes in river loading. In the long term, reducing tributary loading is the only way to reduce nutrient levels in Lake Champlain.