Skip to content
2021
State of the Lake and Ecosystems Indicators Report
Home
Table of Contents
Introduction
Ecosystem Indicators
State of the Lake Summary
Clean Water
Drinkable, Fishable and Swimmable Water
Pathogens
Cyanobacteria
Nutrients
Contaminants
Healthy Ecosystems
Biodiversity and Ecosystem Function
Aquatic Invasive Species
Thriving Communities
Community Health
Champlain Valley National Heritage Partnership
Informed & Involved Public
Education and Outreach
Community Action
Citations
Acknowledgments
About the LCBP
English
Français
English
Menu
Home
Table of Contents
Introduction
Ecosystem Indicators
State of the Lake Summary
Clean Water
Drinkable, Fishable and Swimmable Water
Pathogens
Cyanobacteria
Nutrients
Contaminants
Healthy Ecosystems
Biodiversity and Ecosystem Function
Aquatic Invasive Species
Thriving Communities
Community Health
Champlain Valley National Heritage Partnership
Informed & Involved Public
Education and Outreach
Community Action
Citations
Acknowledgments
About the LCBP
English
Français
English
Introduction
Introduction
Ecosystem Indicators
State of the Lake Summary
Clean Water
Drinkable, Fishable and Swimmable Water
Pathogens
Cyanobacteria
Nutrients
Contaminants
Healthy Ecosystems
Biodiversity and Ecosystem Function
Aquatic Invasive Species
Thriving Communities
Community Health
Champlain Valley National Heritage Partnership
Informed & Involved Public
Education and Outreach
Community Action
Menu
Introduction
Ecosystem Indicators
State of the Lake Summary
Clean Water
Drinkable, Fishable and Swimmable Water
Pathogens
Cyanobacteria
Nutrients
Contaminants
Healthy Ecosystems
Biodiversity and Ecosystem Function
Aquatic Invasive Species
Thriving Communities
Community Health
Champlain Valley National Heritage Partnership
Informed & Involved Public
Education and Outreach
Community Action
Figures and Graphics
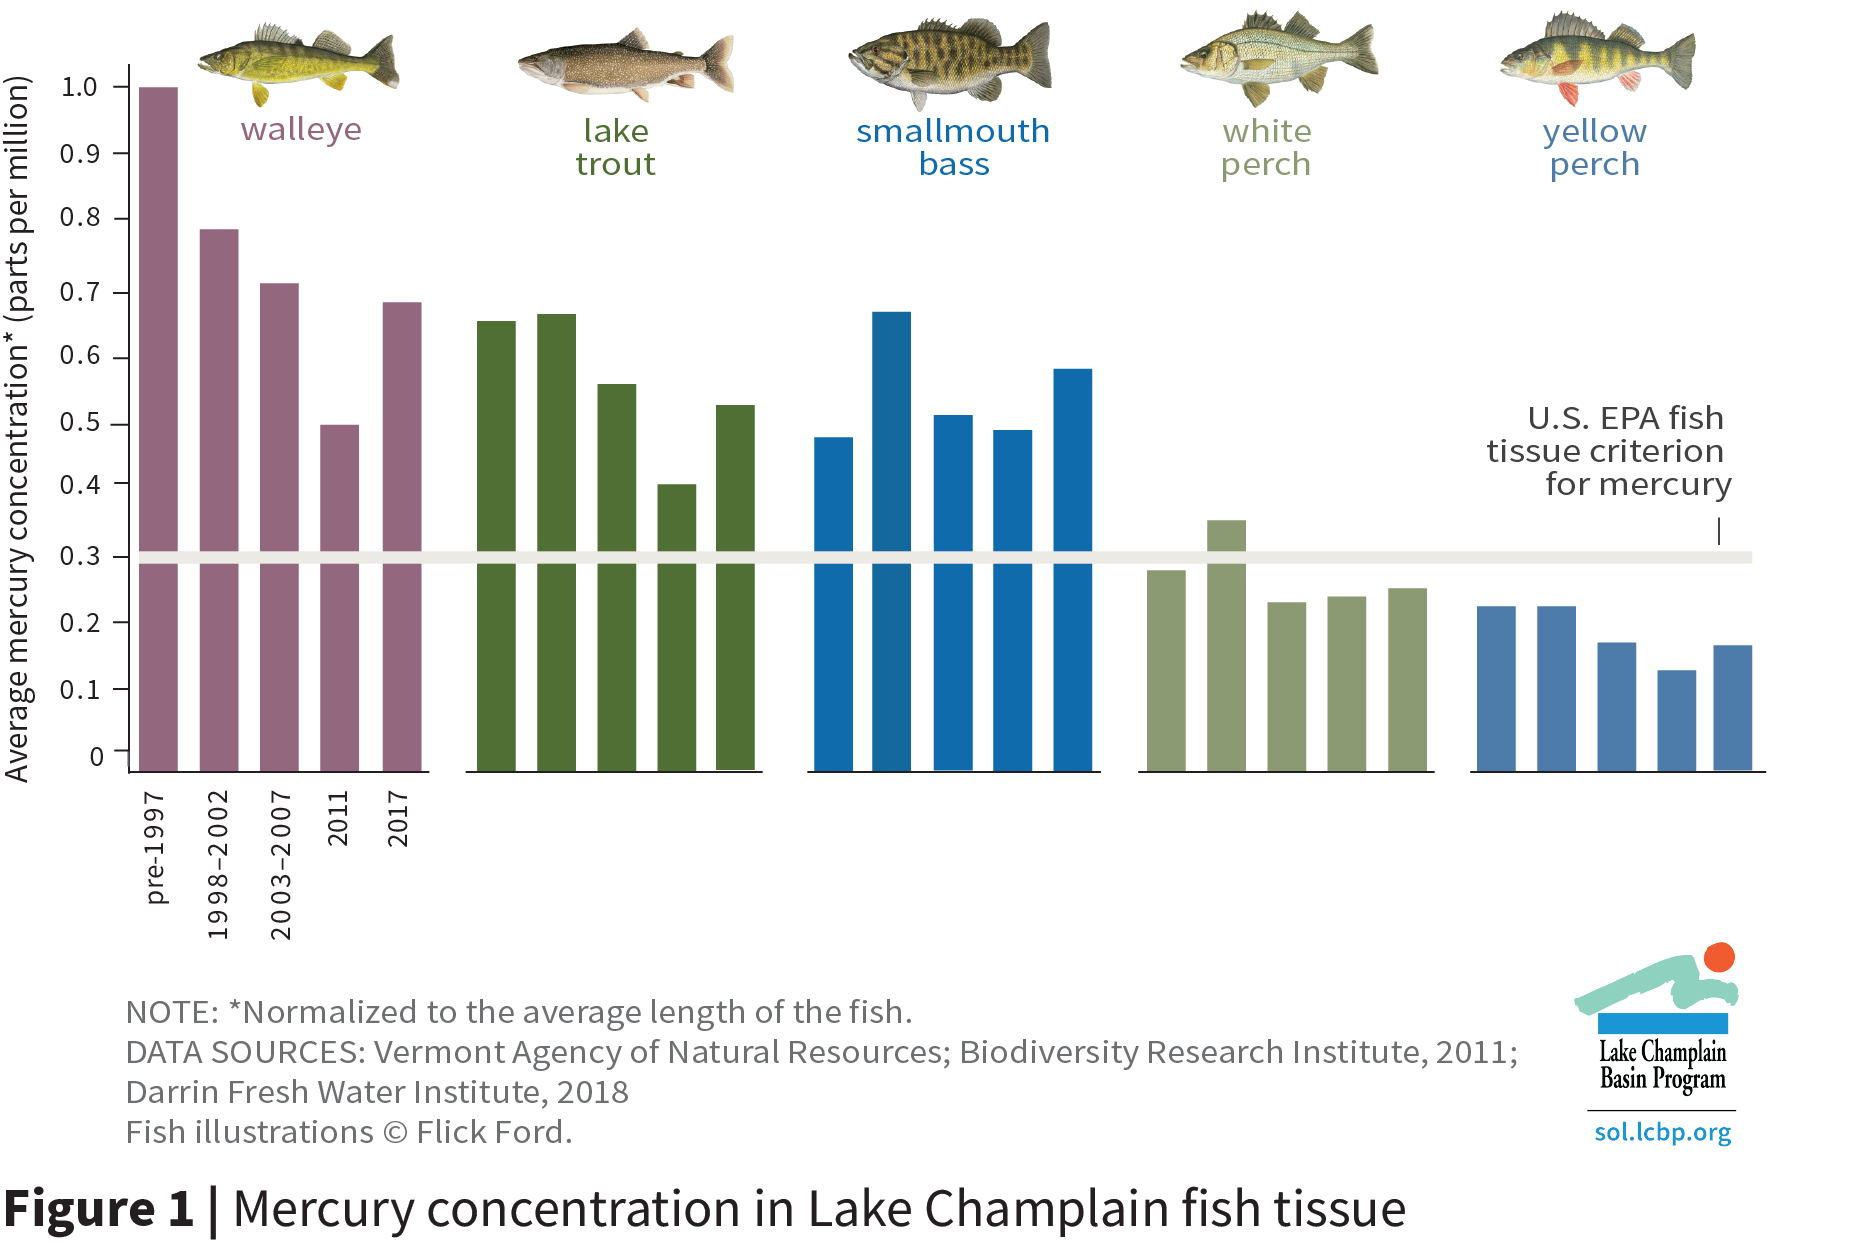
Figure 1
Mercury concentration in Lake Champlain fish tissue
Download >>
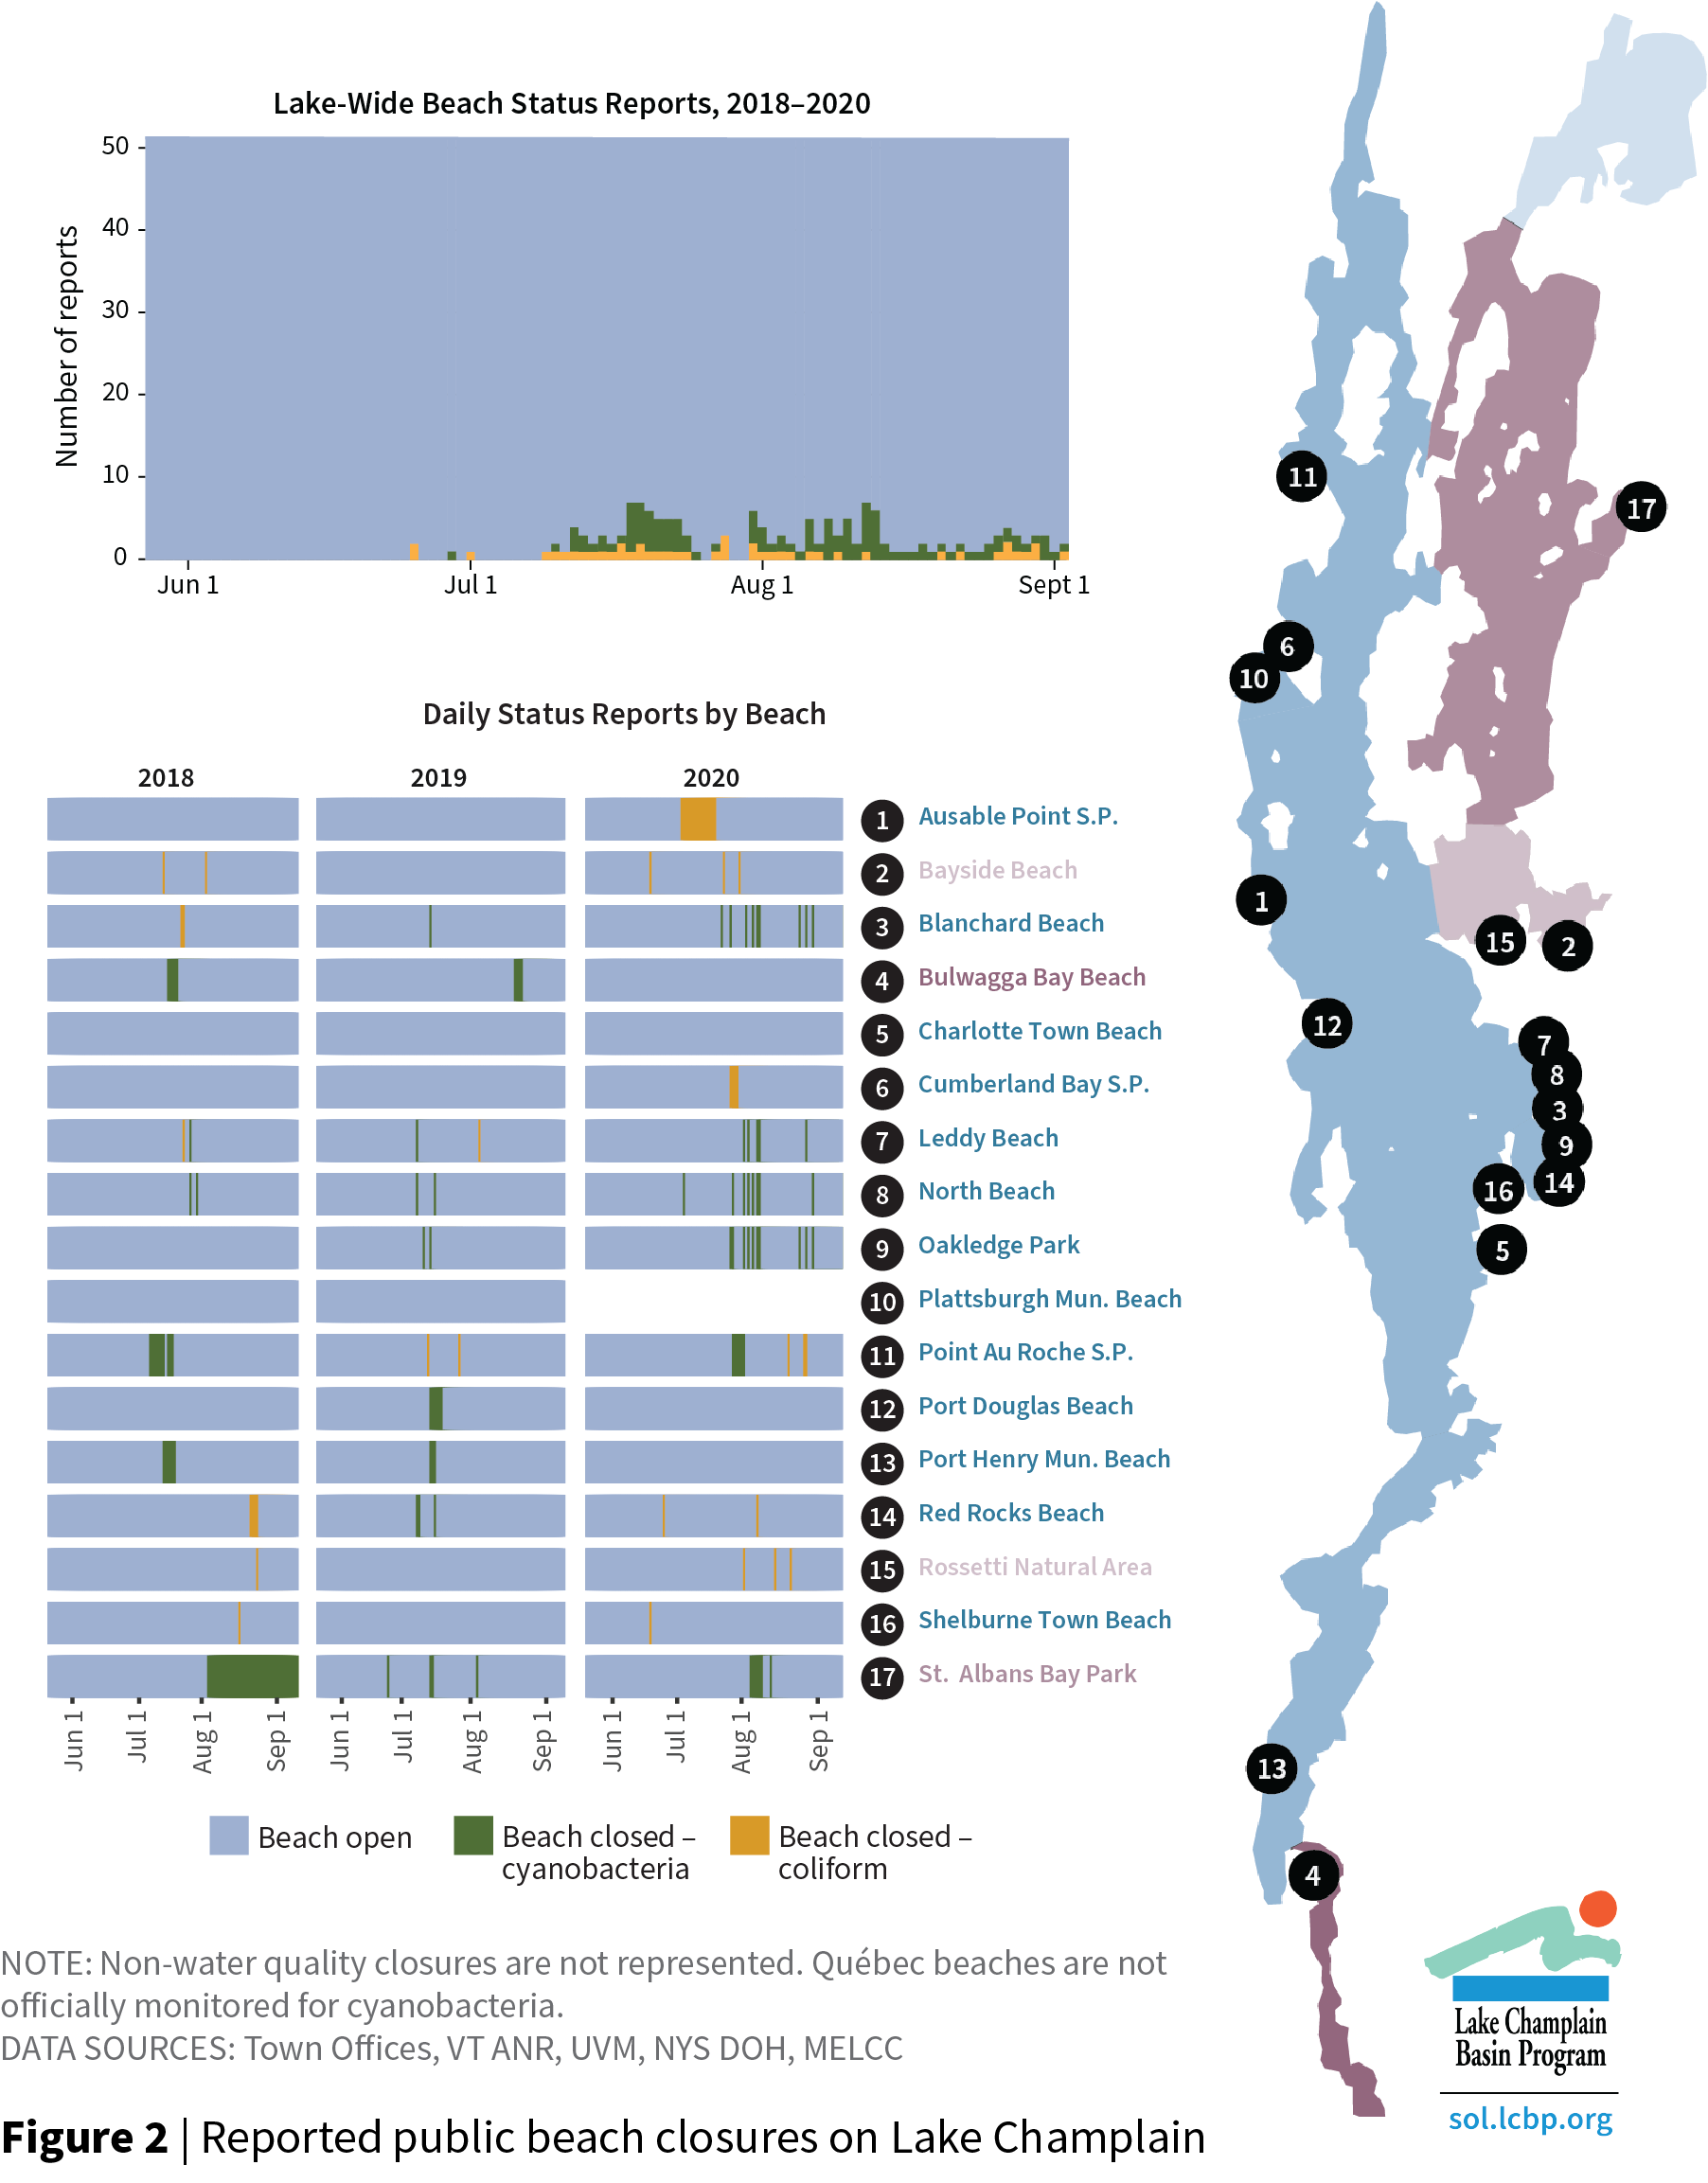
Figure 2
Reported public beach closures on Lake Champlain
Download >>
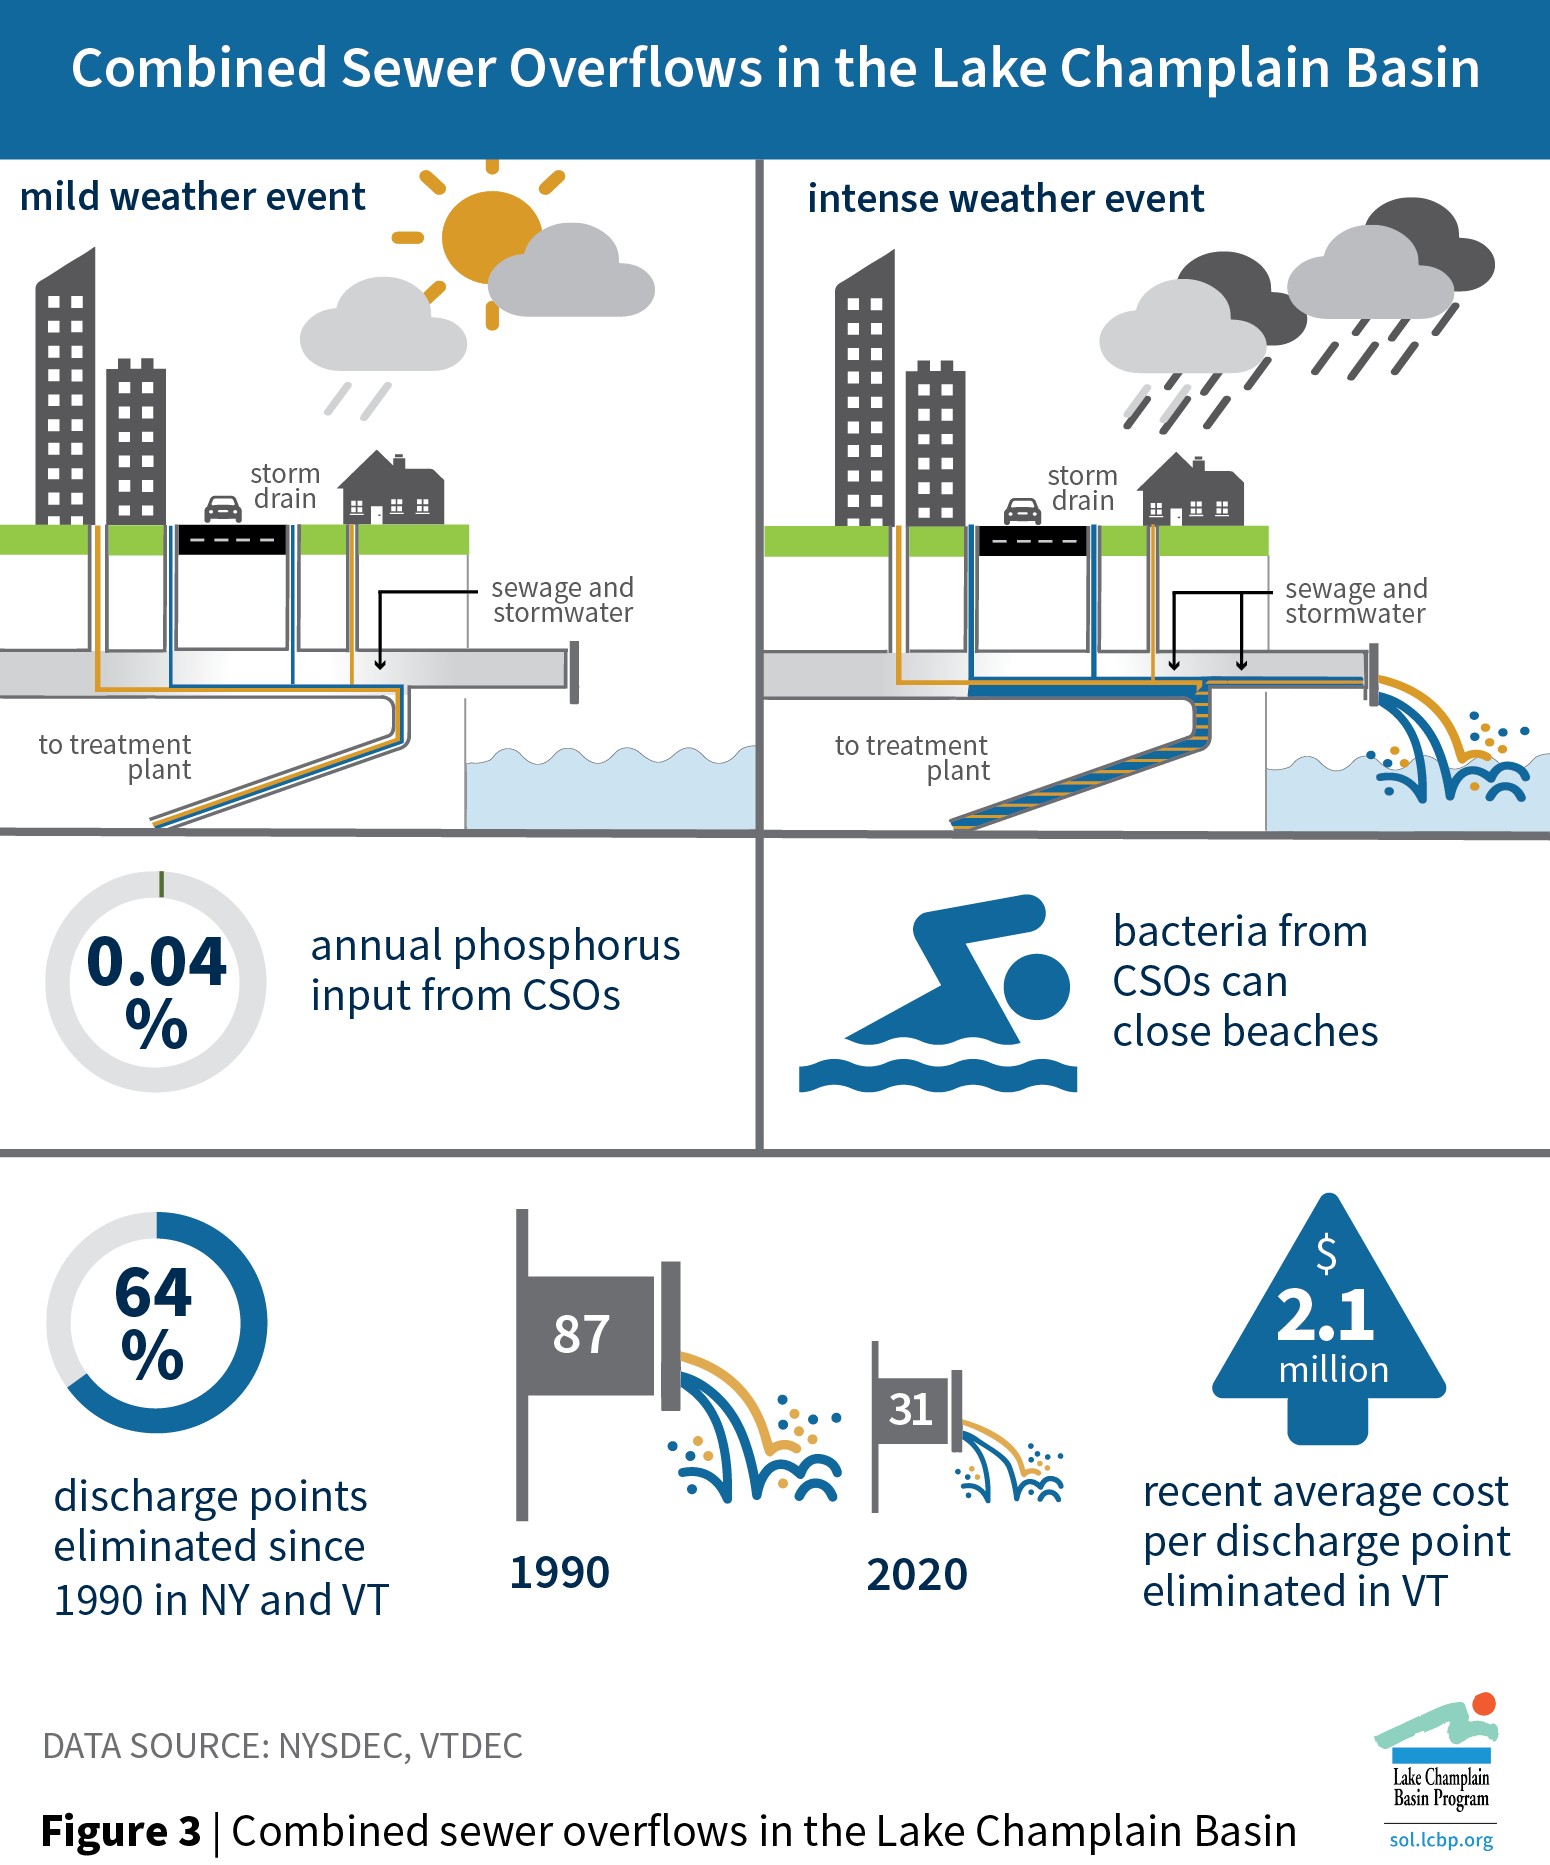
Figure 3
Combined sewer overflows in the Lake Champlain Basin
Download >>
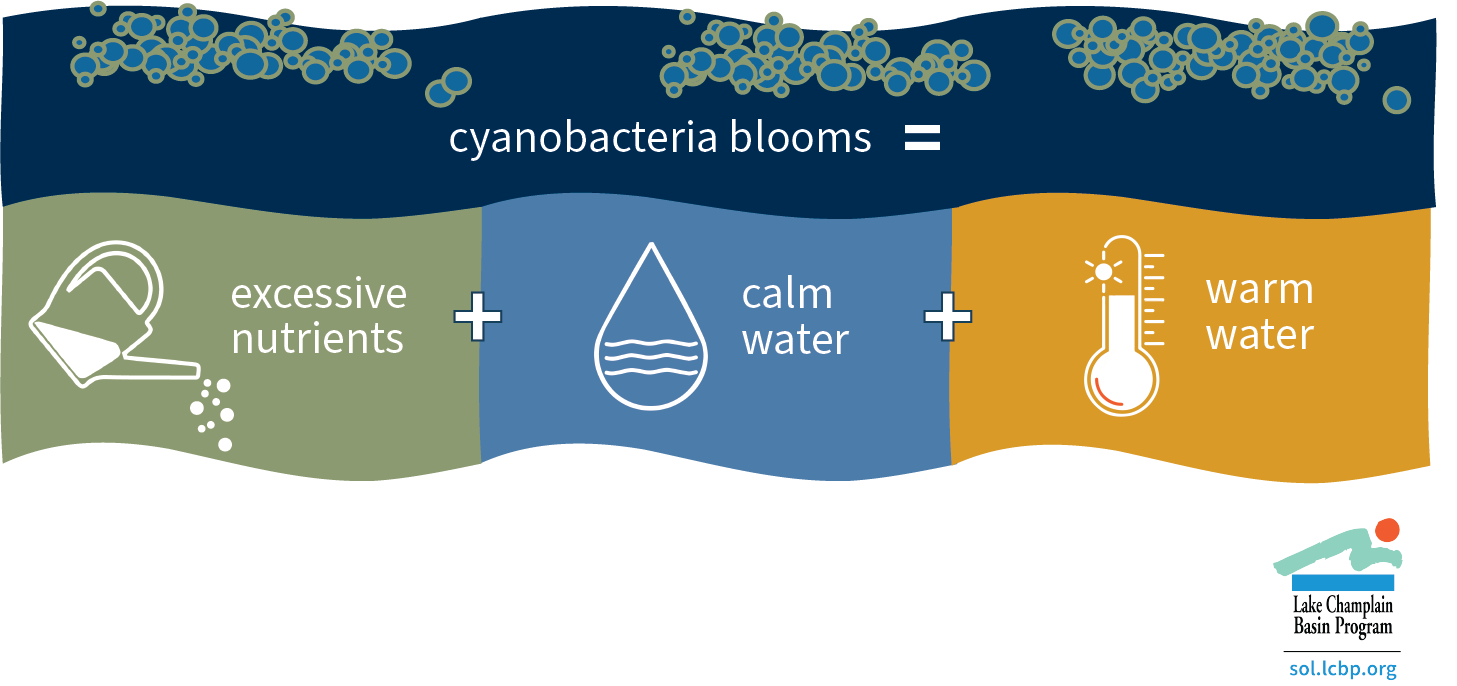
Infographic
Cyanobacteria formation
Download >>
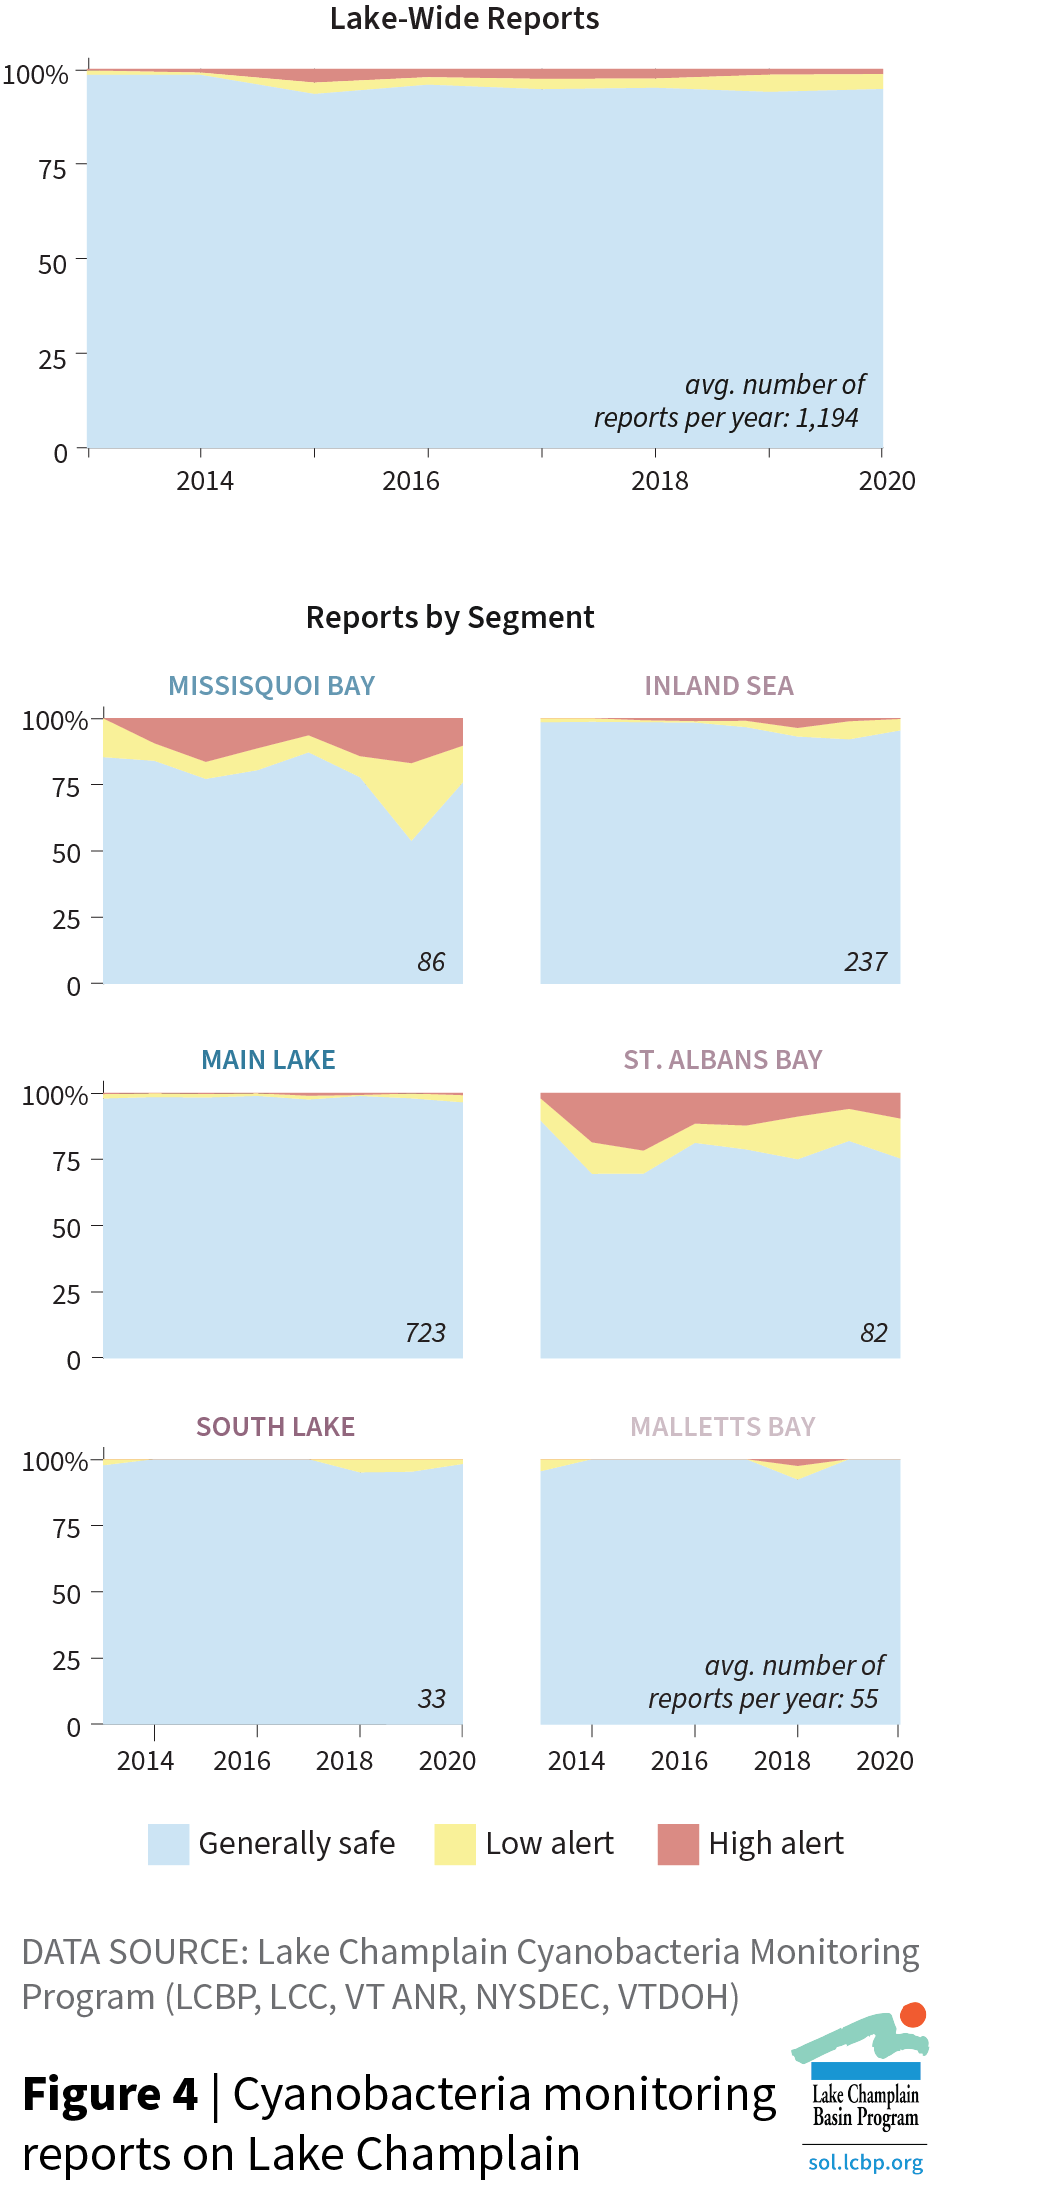
Figure 4
Cyanobacteria monitoring reports on Lake Champlain
Download >>
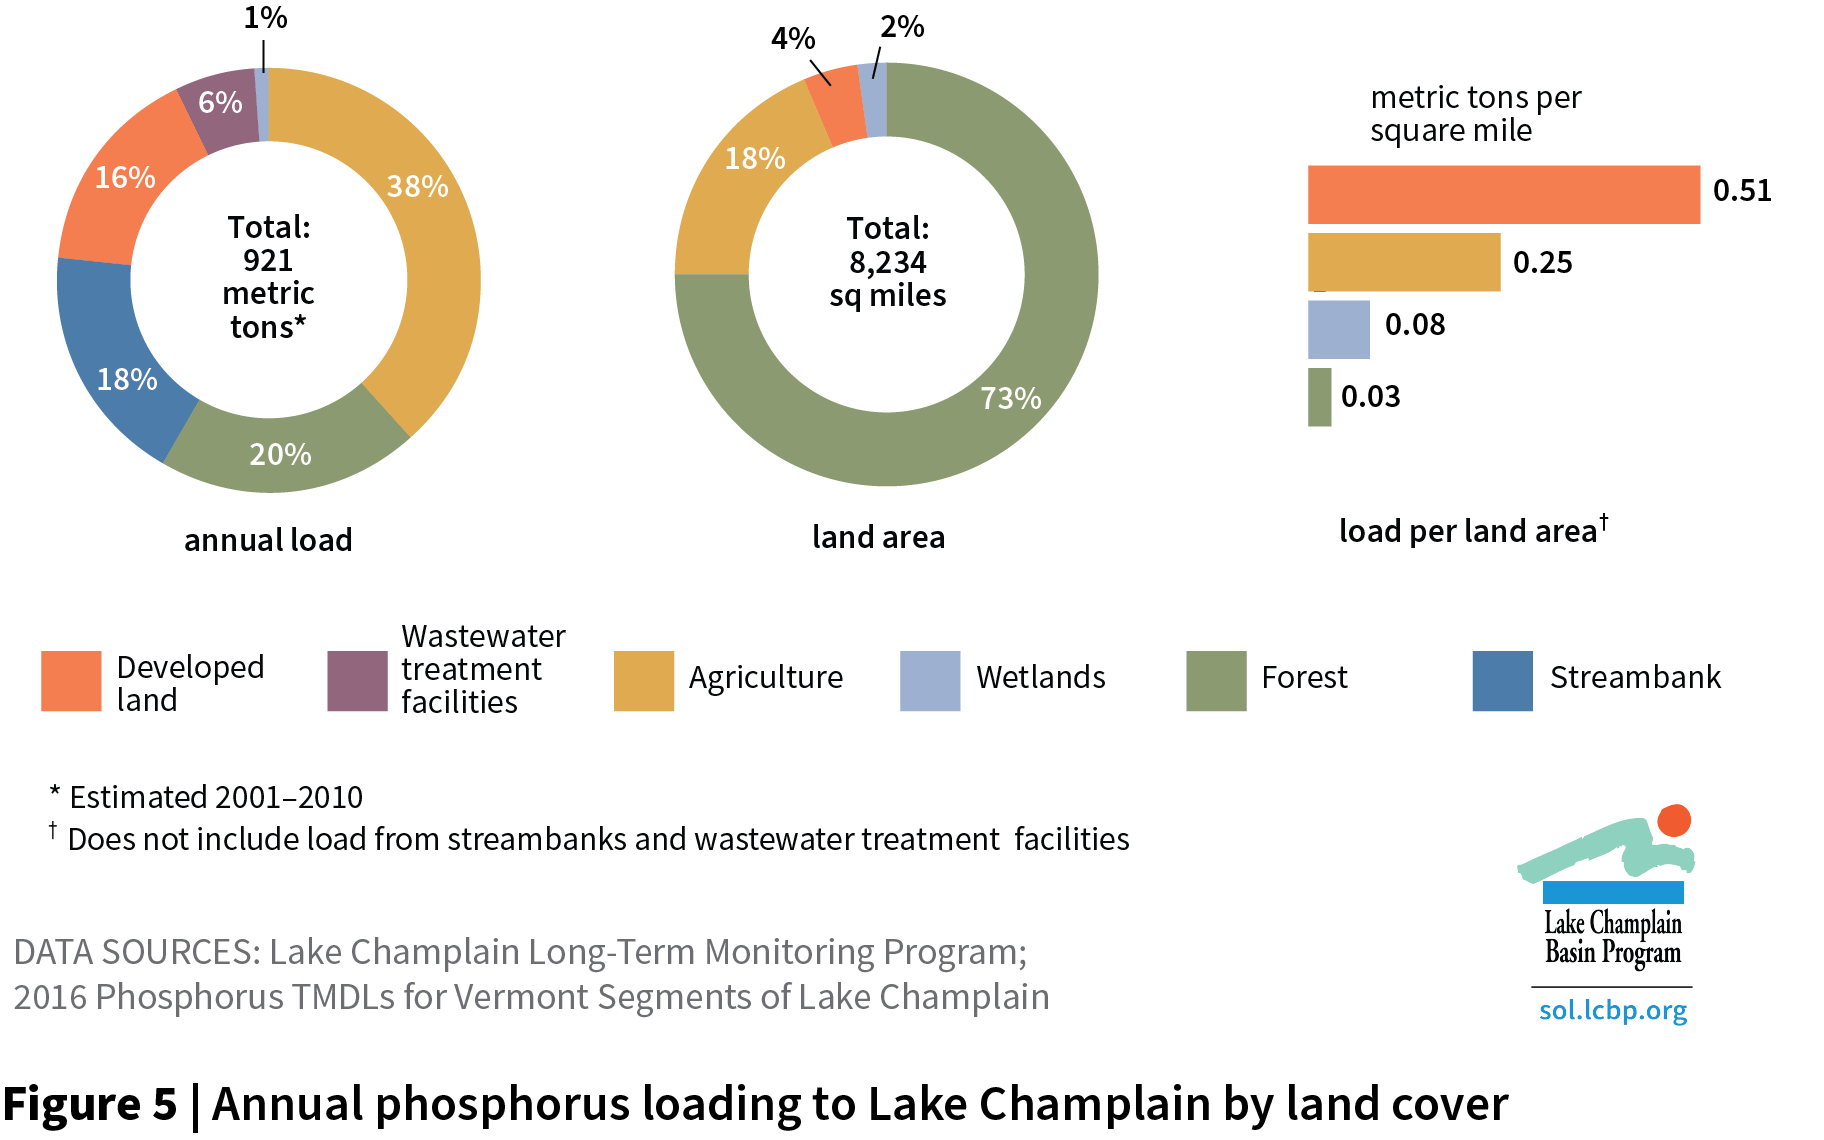
Figure 5
Annual phosphorus loading to Lake Champlain by land cover
Download >>
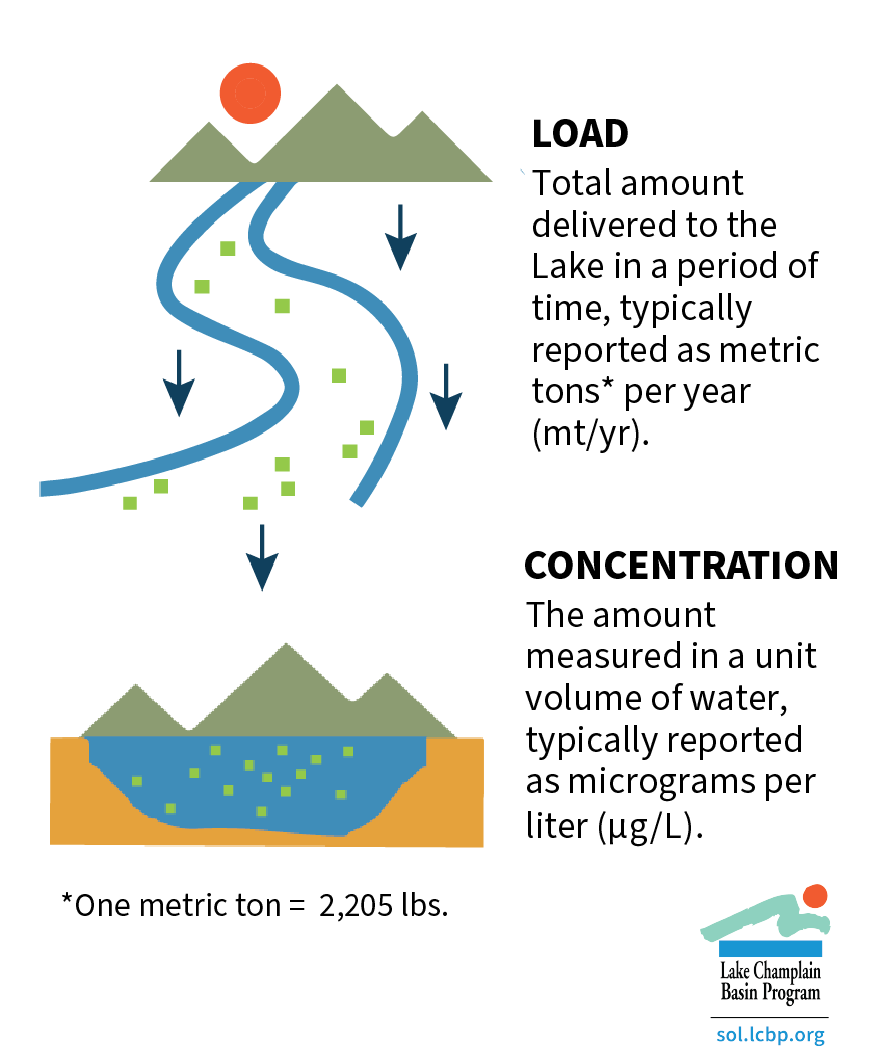
Infographic
Load vs. concentration
Download >>
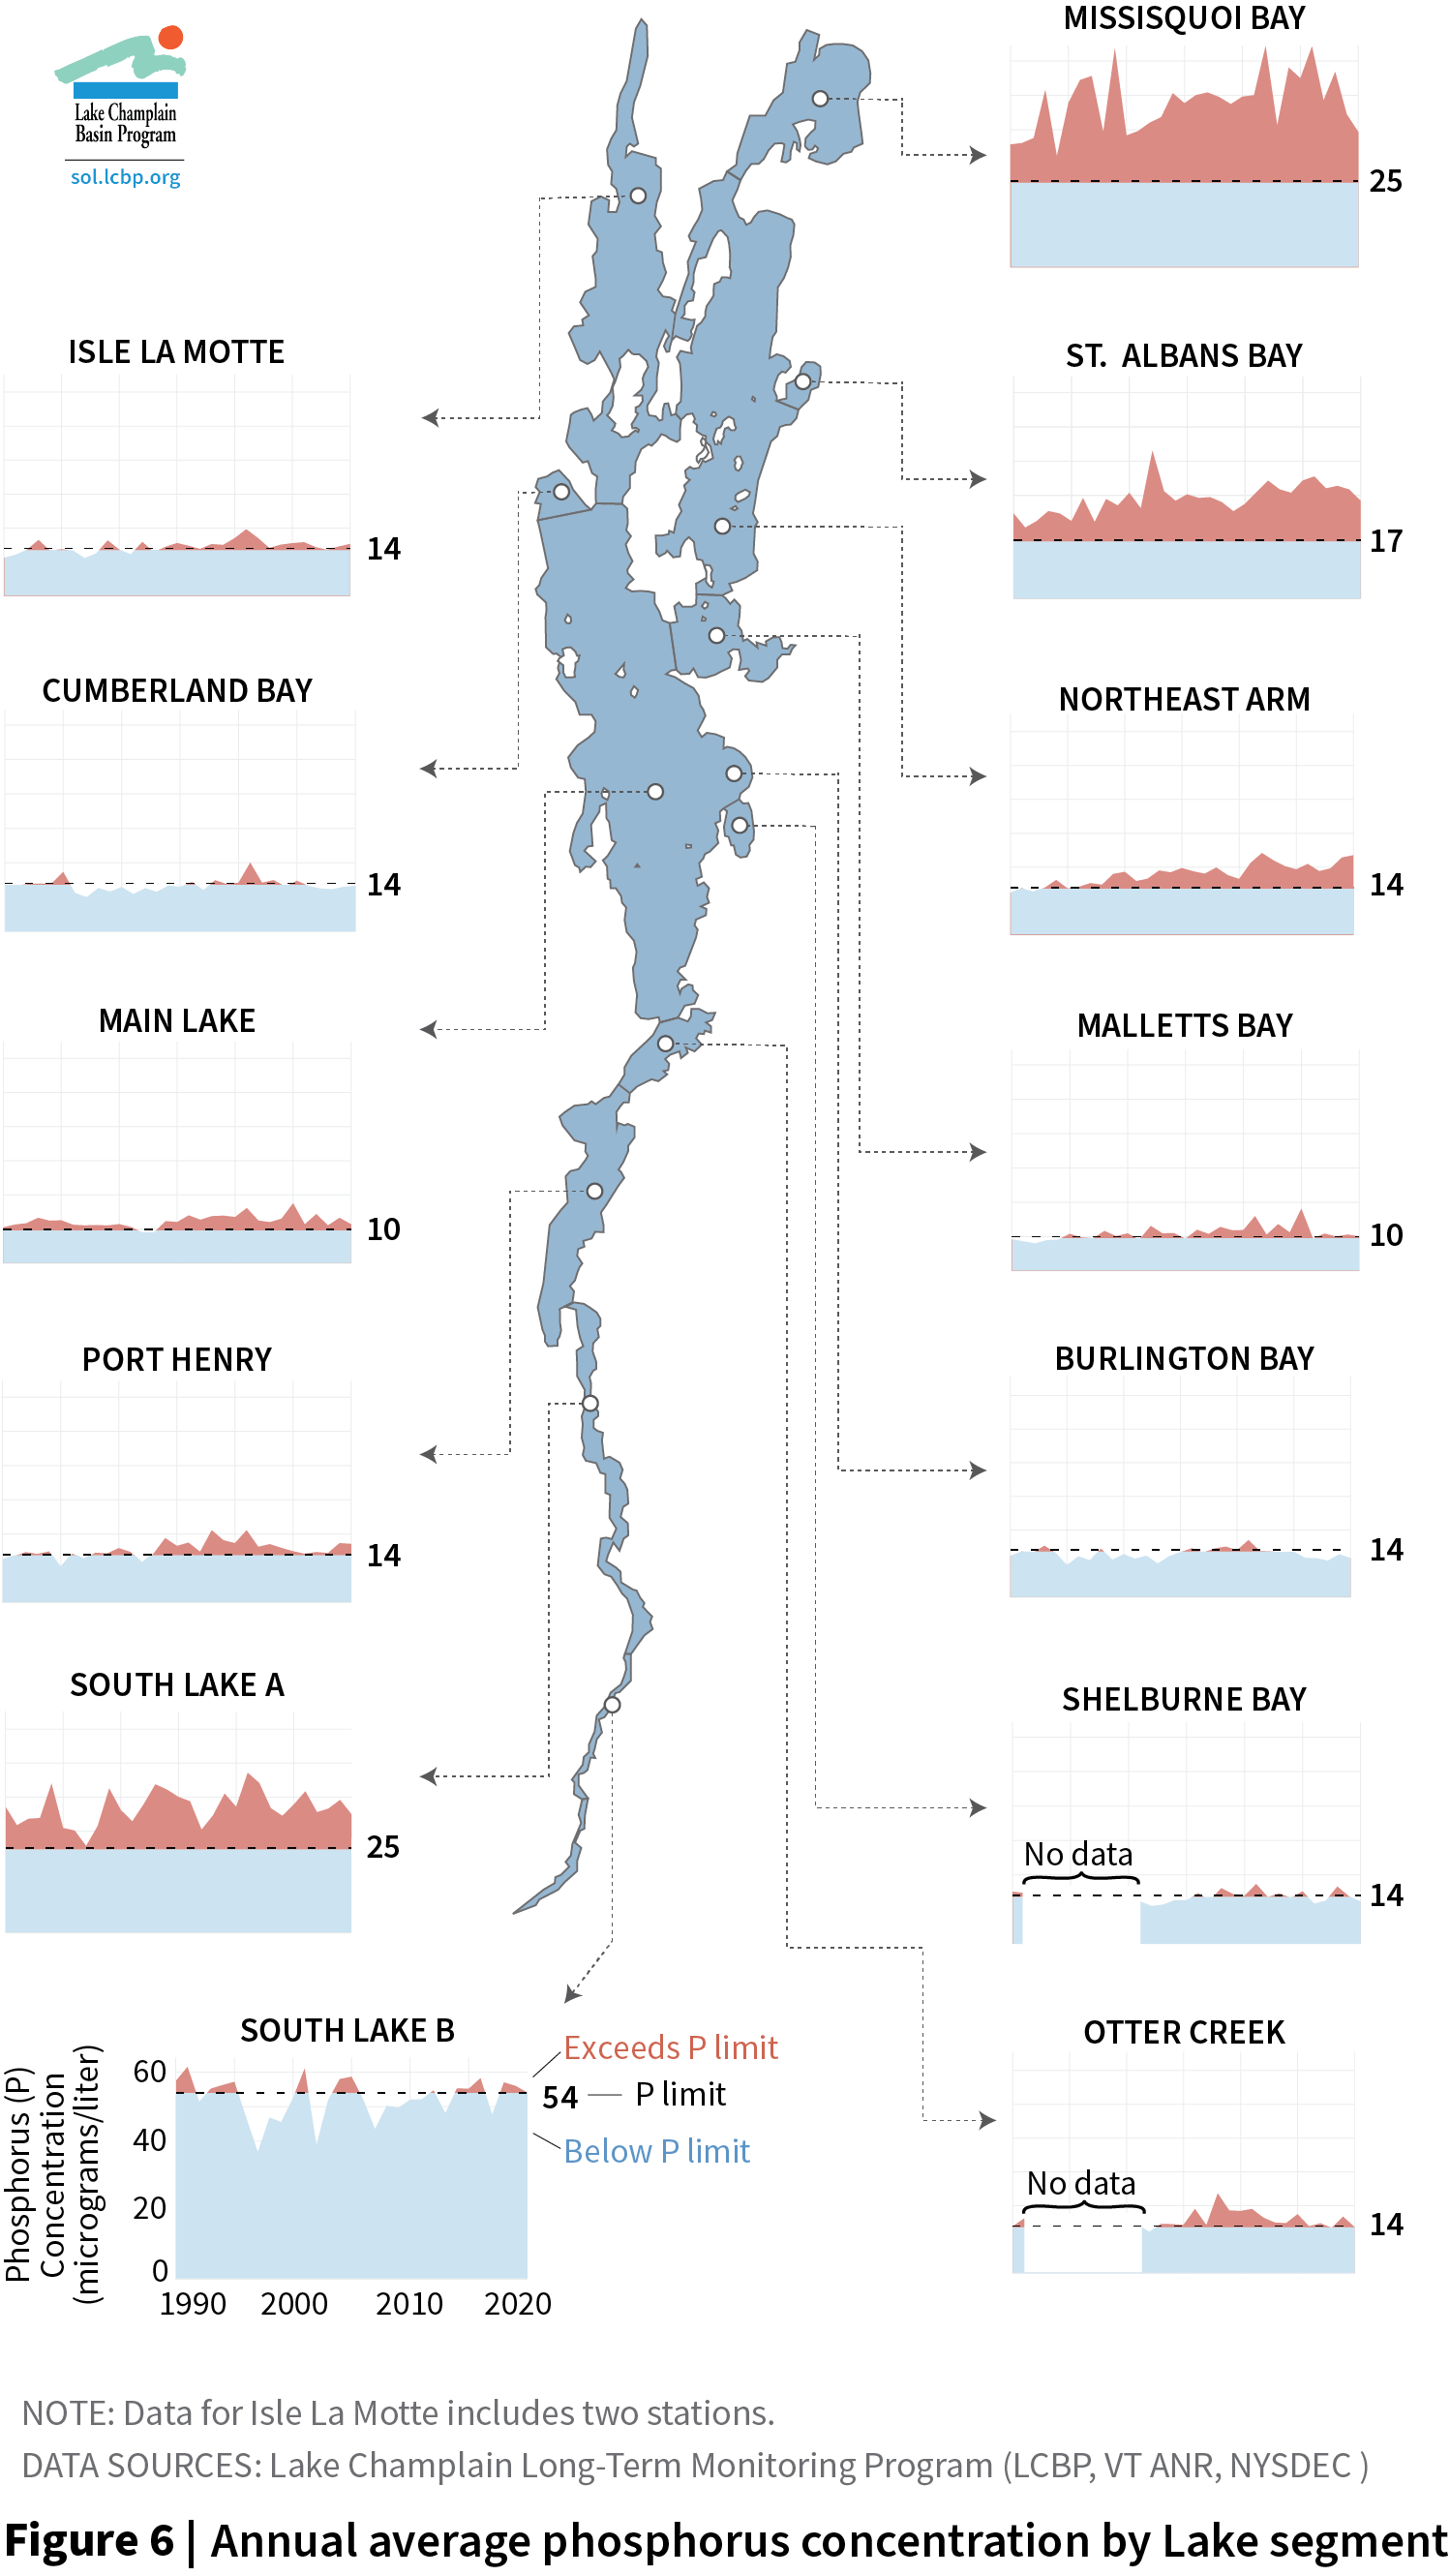
Figure 6
Annual average phosphorus concentration by Lake segment
Download >>
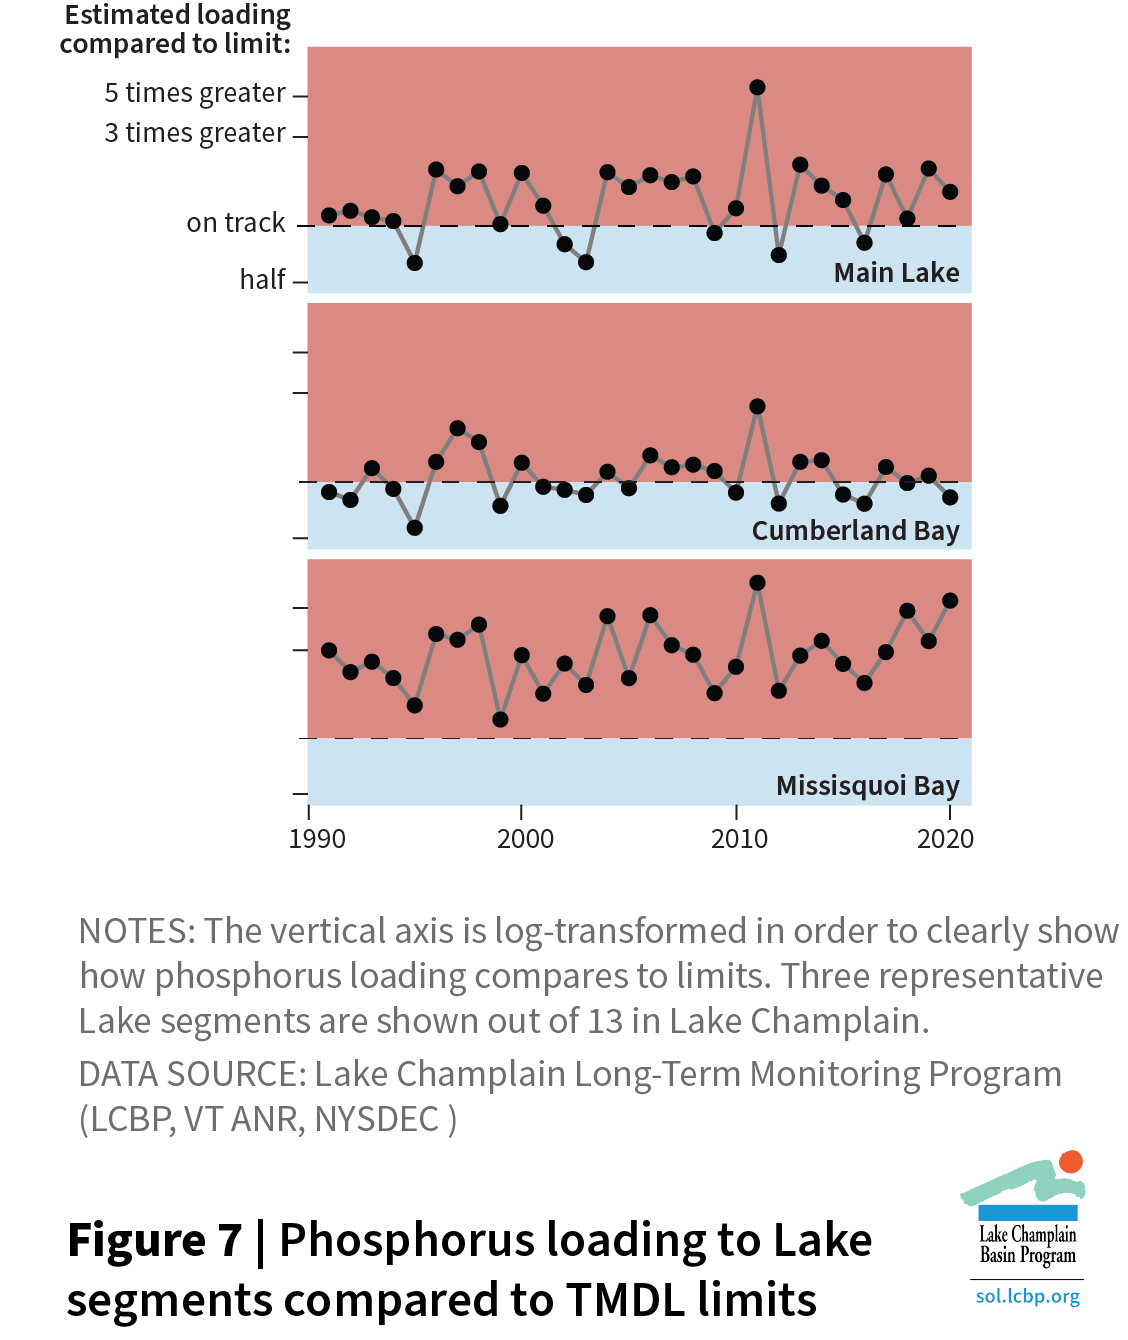
Figure 7
Phosphorus loading to Lake segments compared to TMDL limits
Download >>
Figure 8
Annual phosphorus load from wastewater treatment facilities by jurisdiction
Download >>
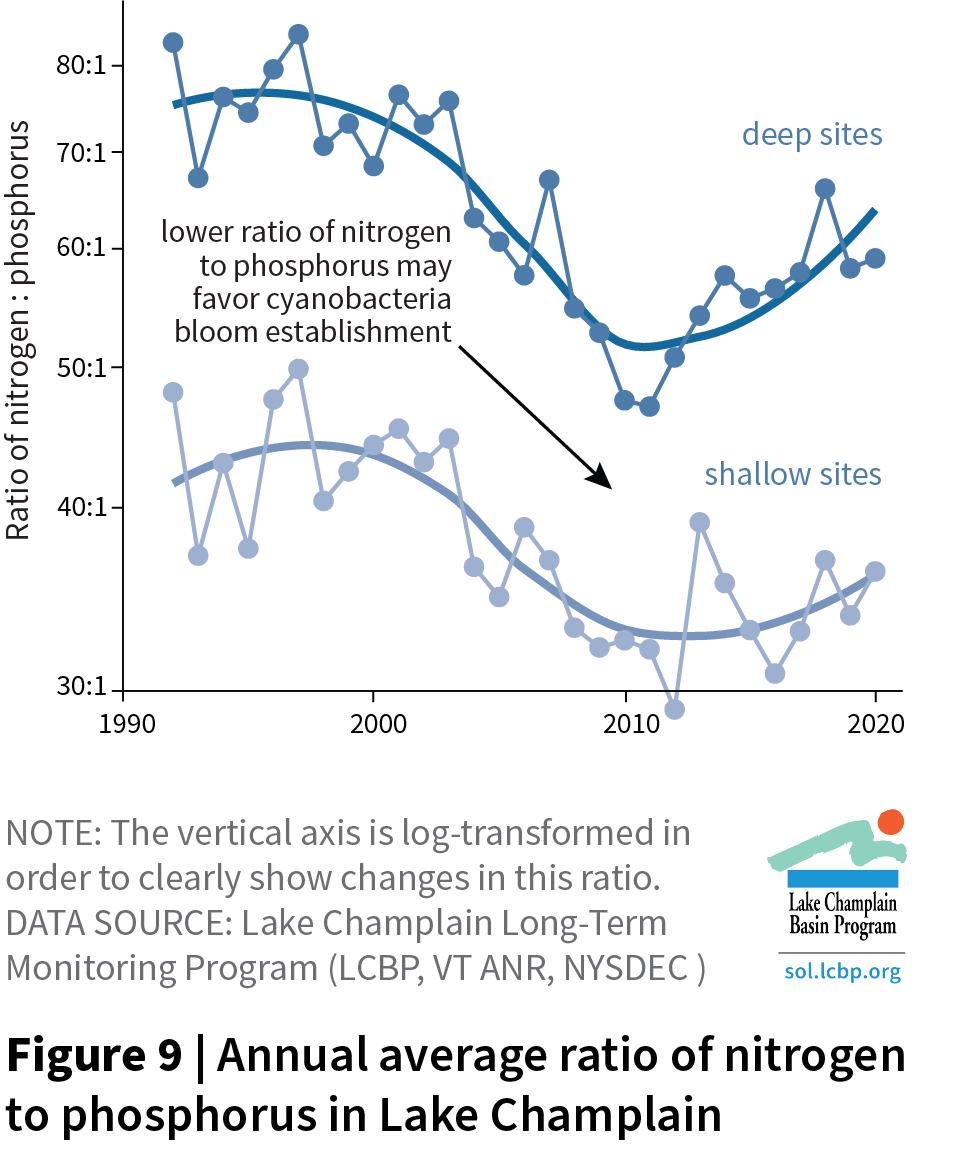
Figure 9
Annual average ratio of nitrogen to phosphorus in Lake Champlain
Download >>
Figure 10
Annual average chloride concentration in Lake Champlain
Download >>
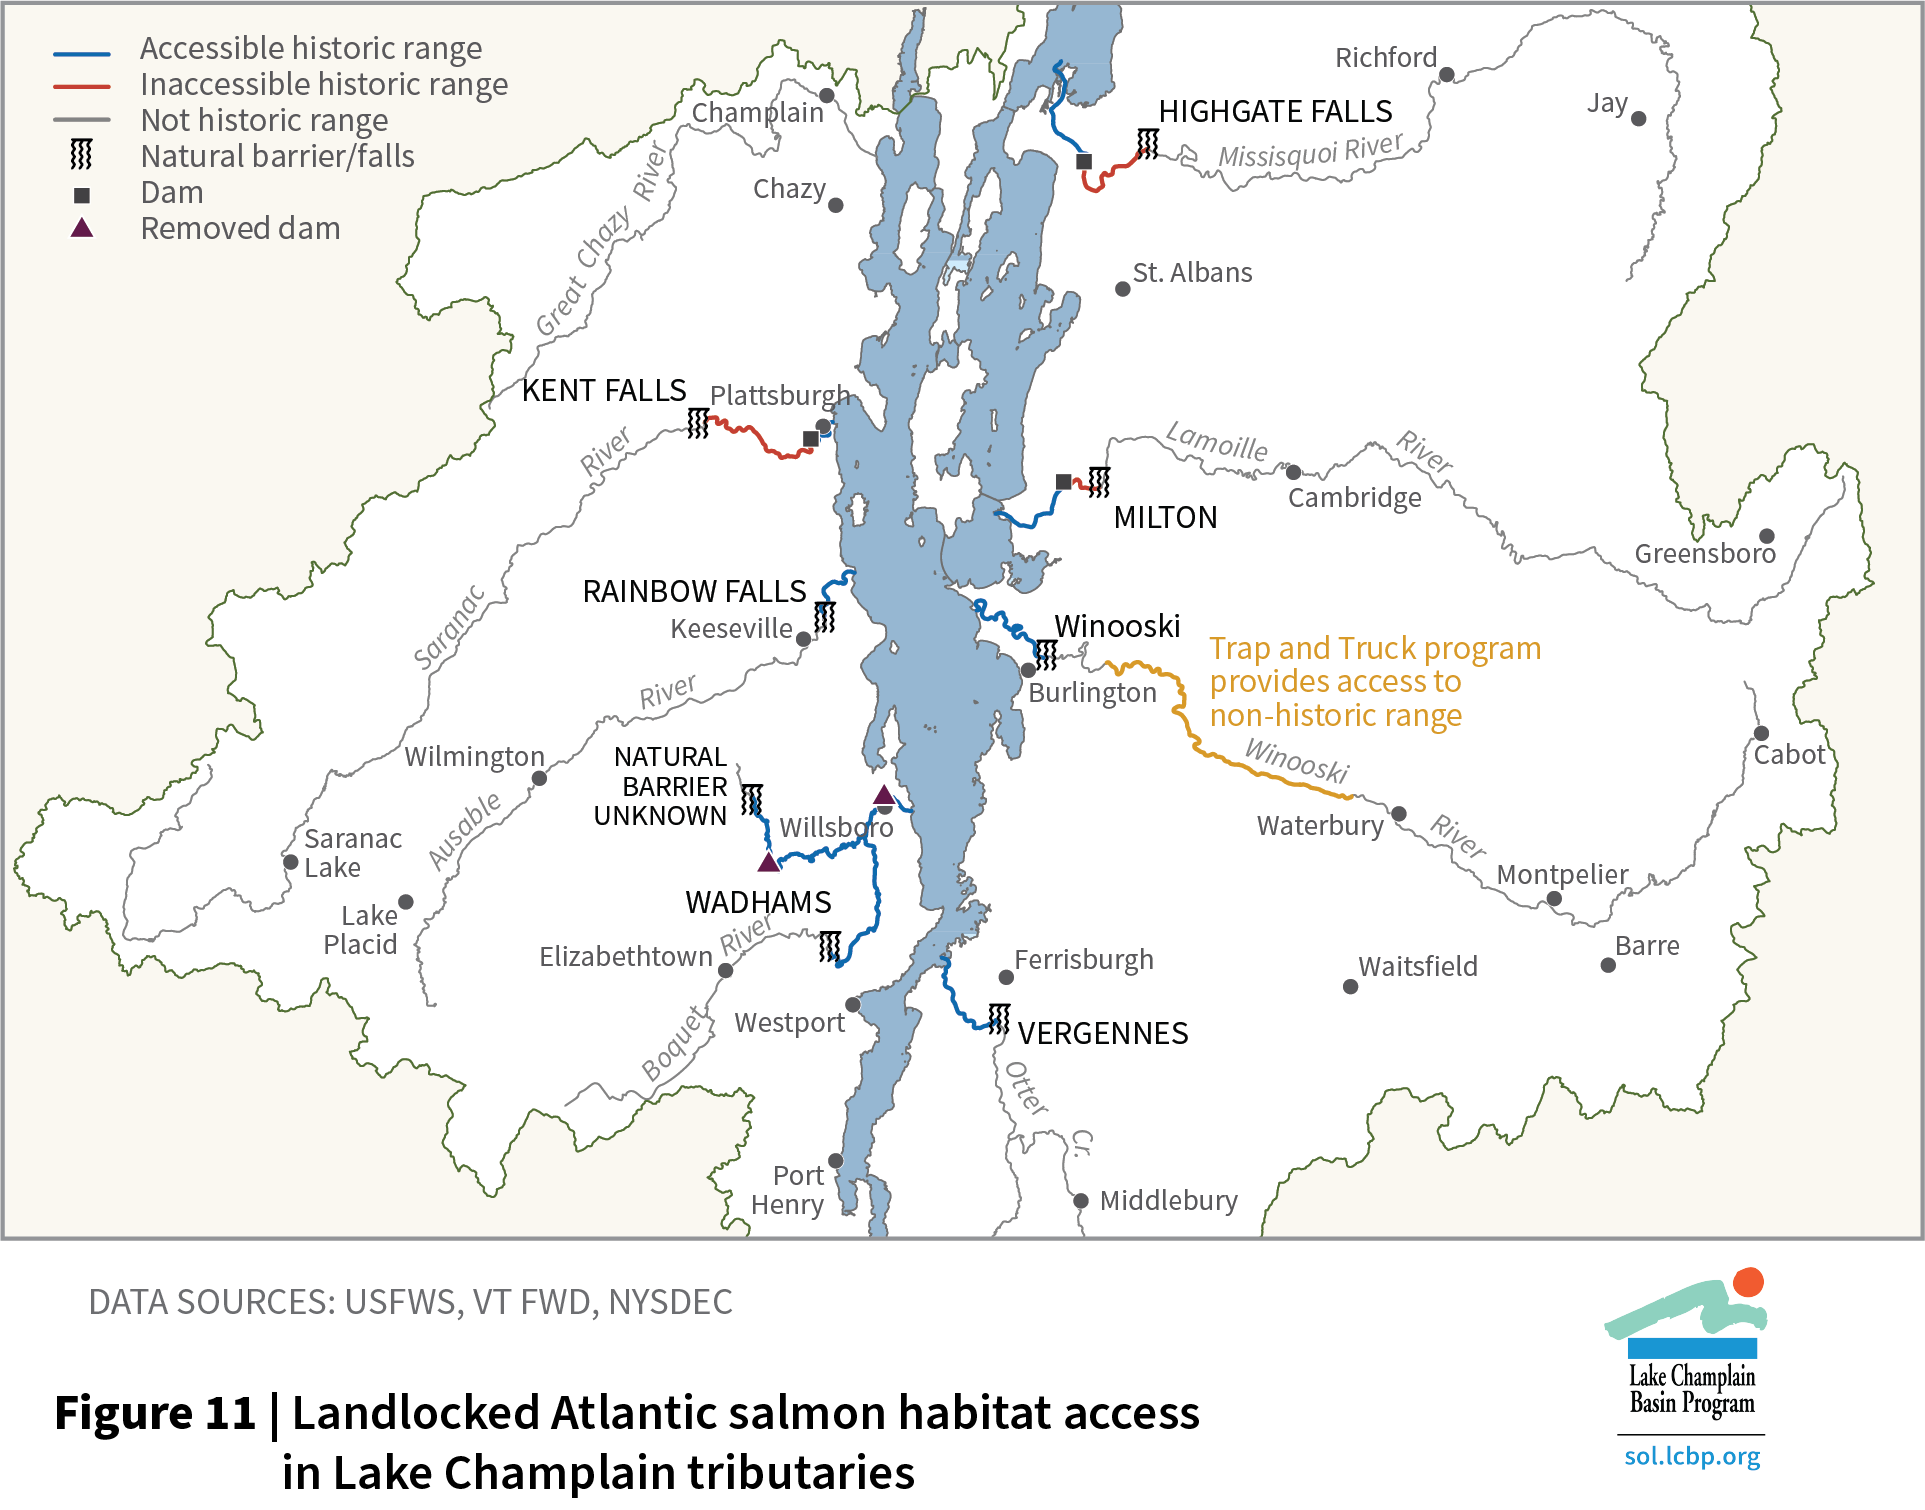
Figure 11
Landlocked Atlantic salmon habitat access in Lake Champlain tributaries
Download >>
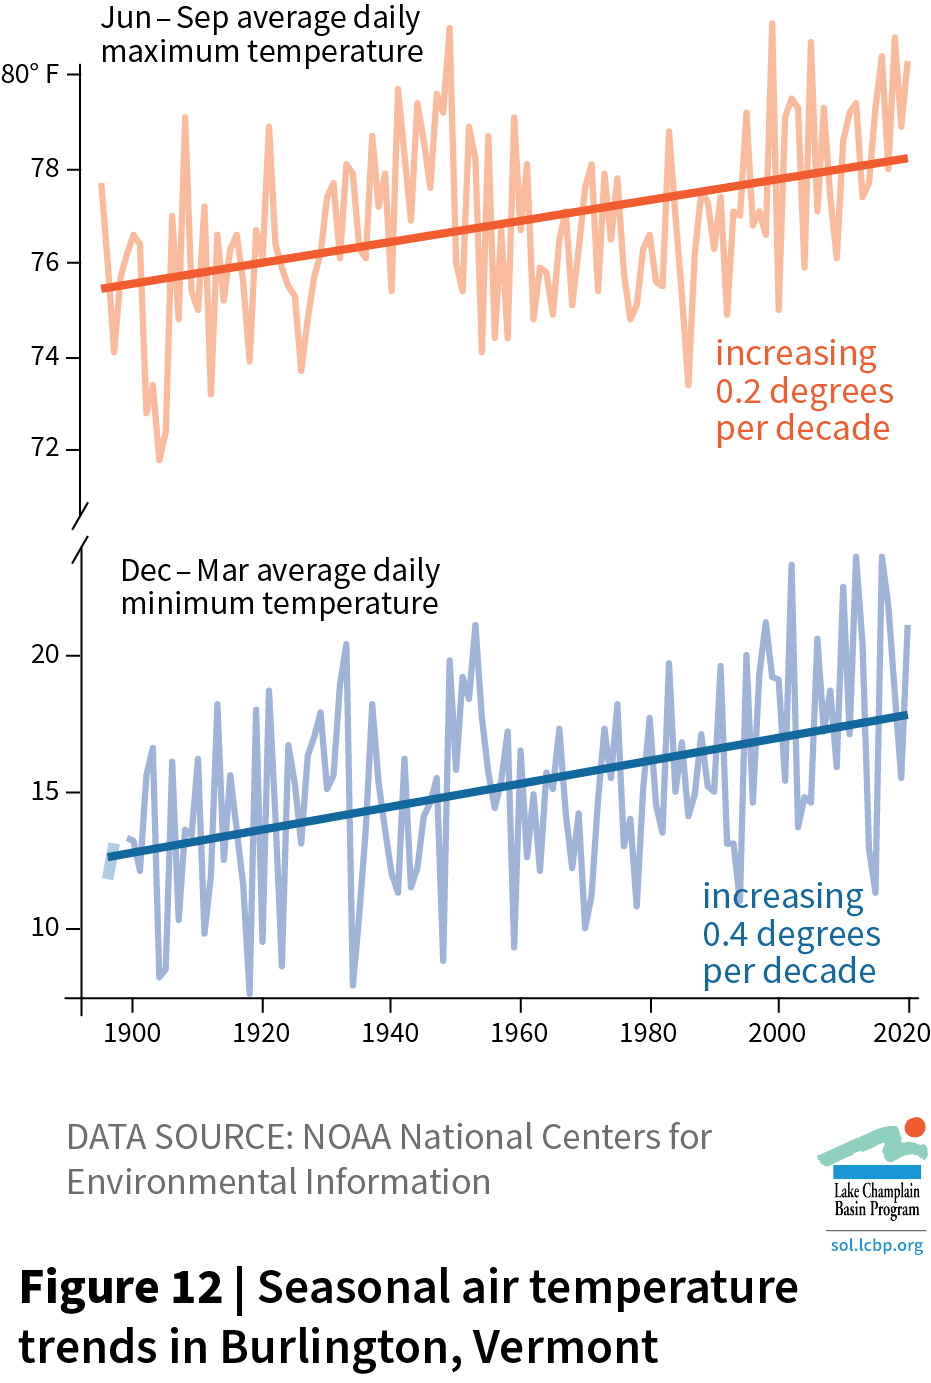
Figure 12
Seasonal air temperature trends in Burlington, Vermont
Download >>
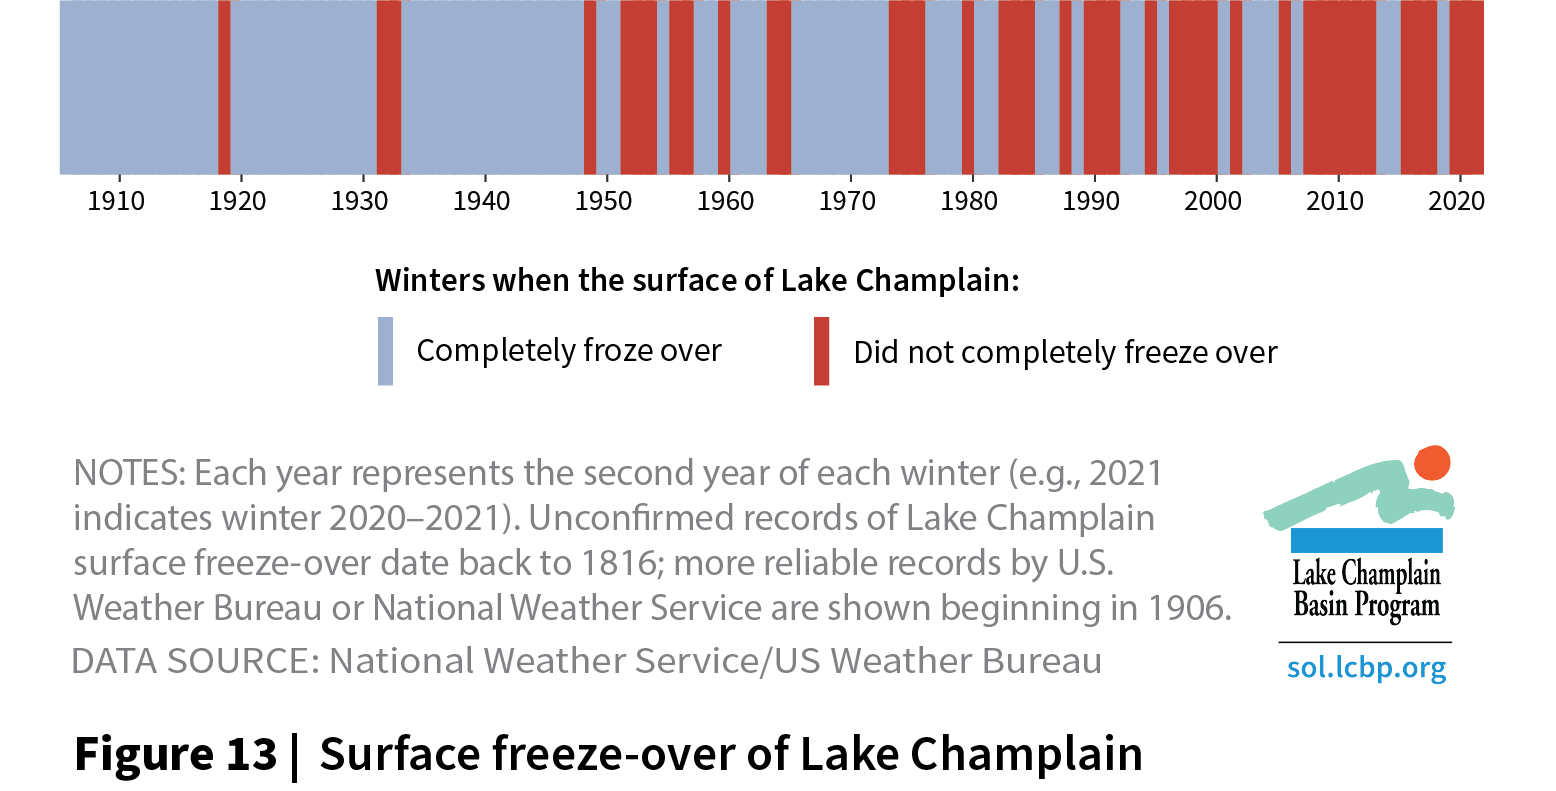
Figure 13
Surface freeze-over of Lake Champlain
Download >>
Figure 14
Probability of Lake Champlain surface freeze-over
Download >>
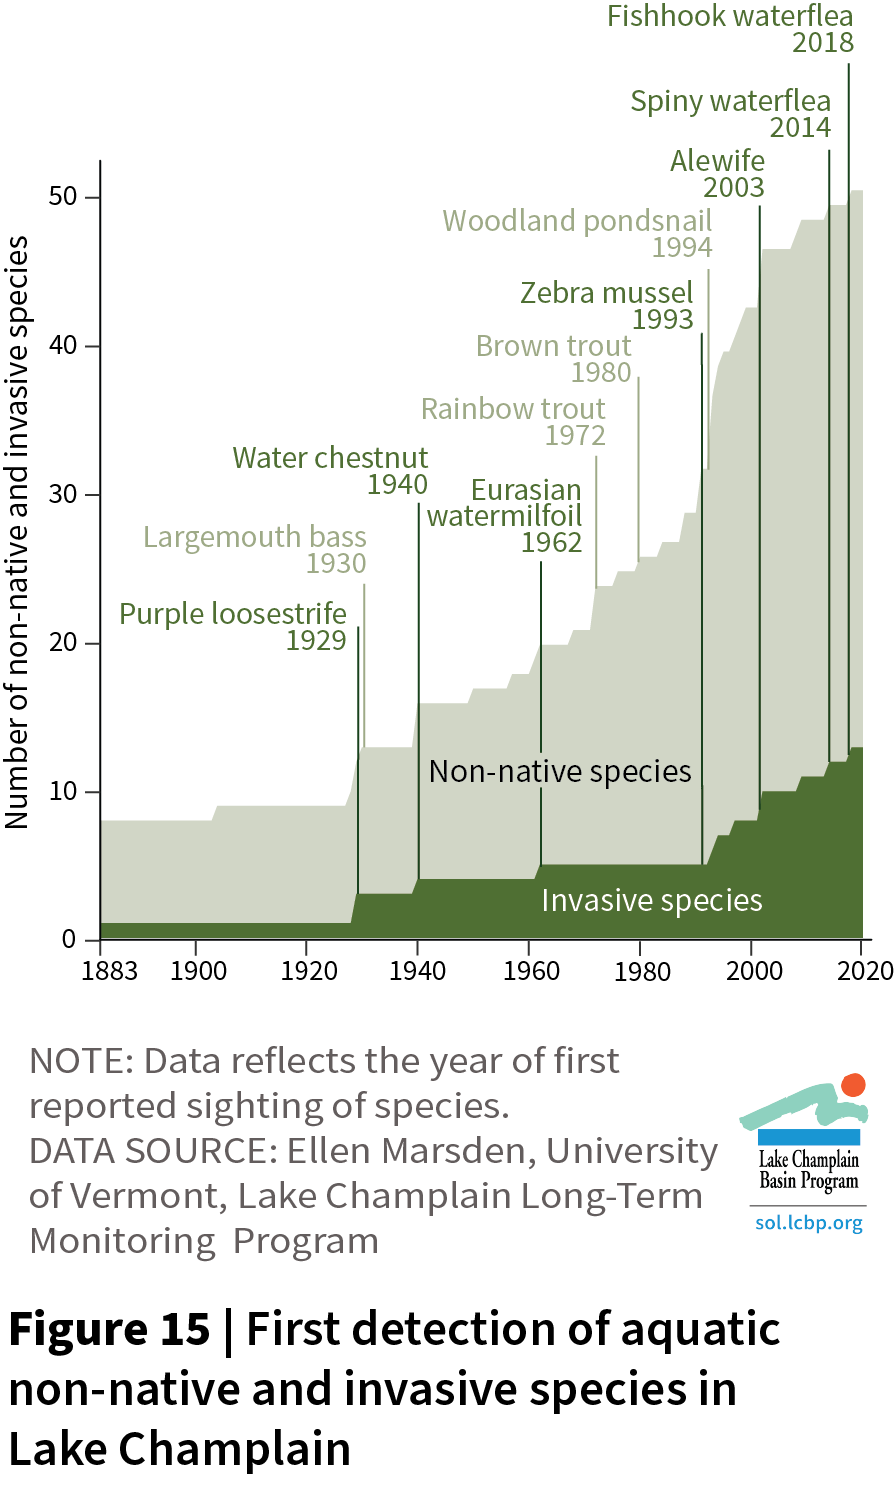
Figure 15
First detection of aquatic non-native and invasive species in Lake Champlain
Download >>
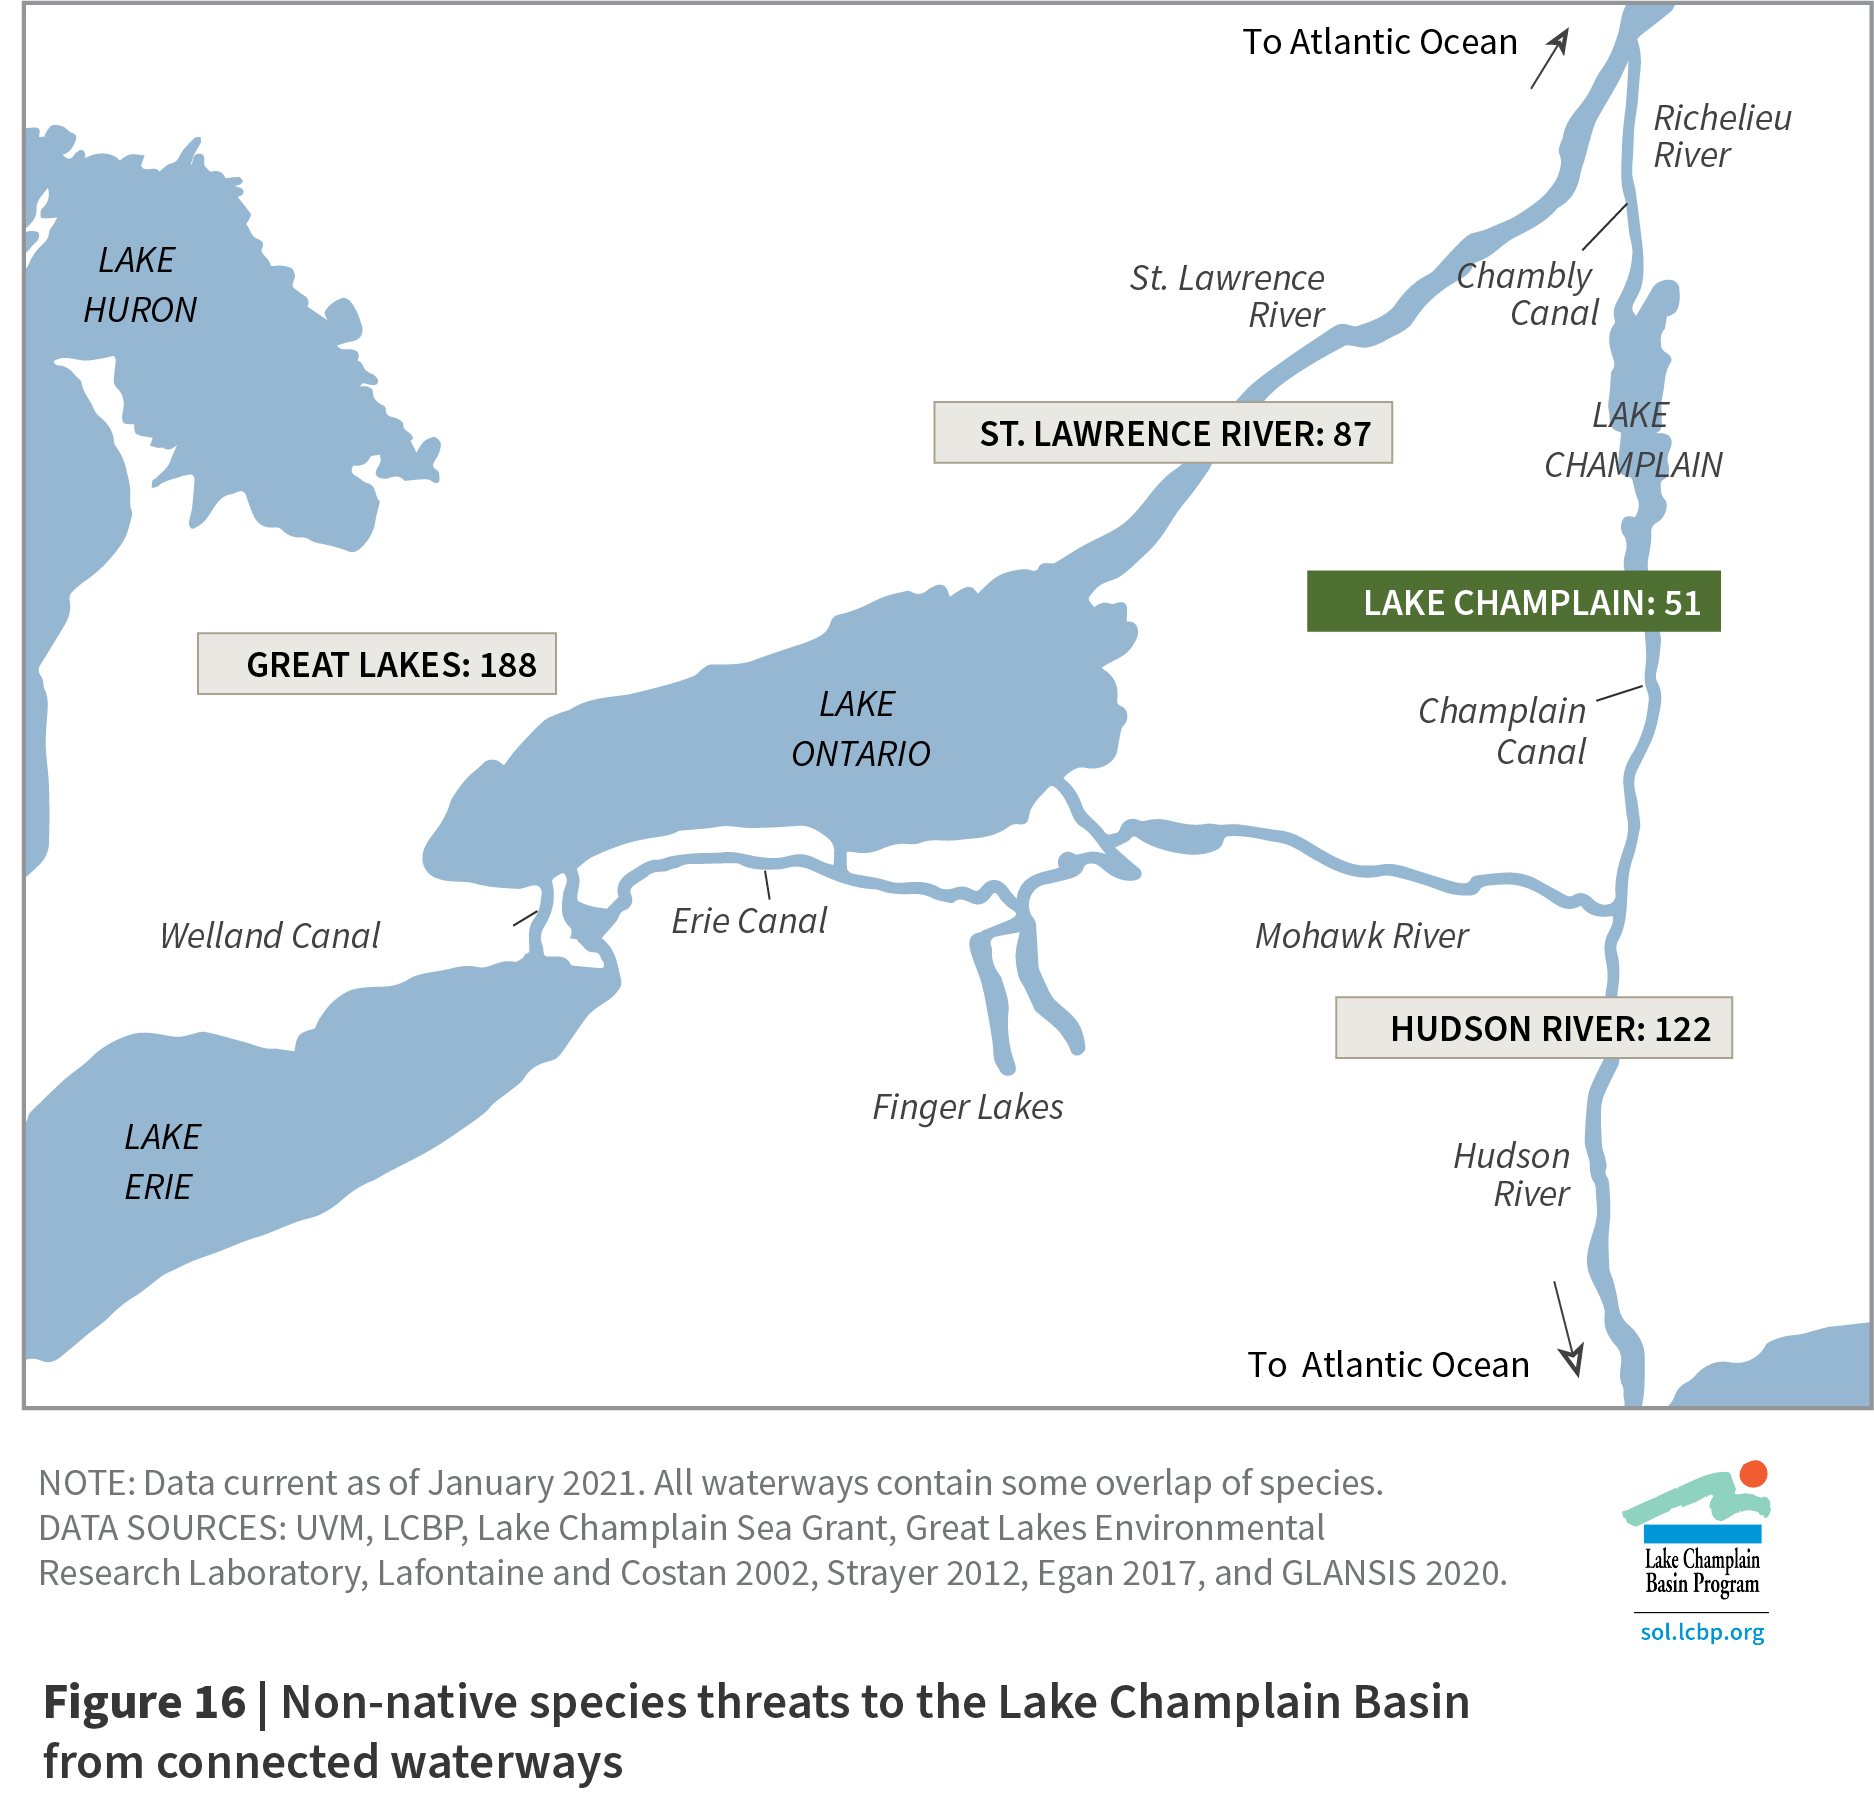
Figure 16
Non-native species threats to the Lake Champlain Basin from connected waterways
Download >>
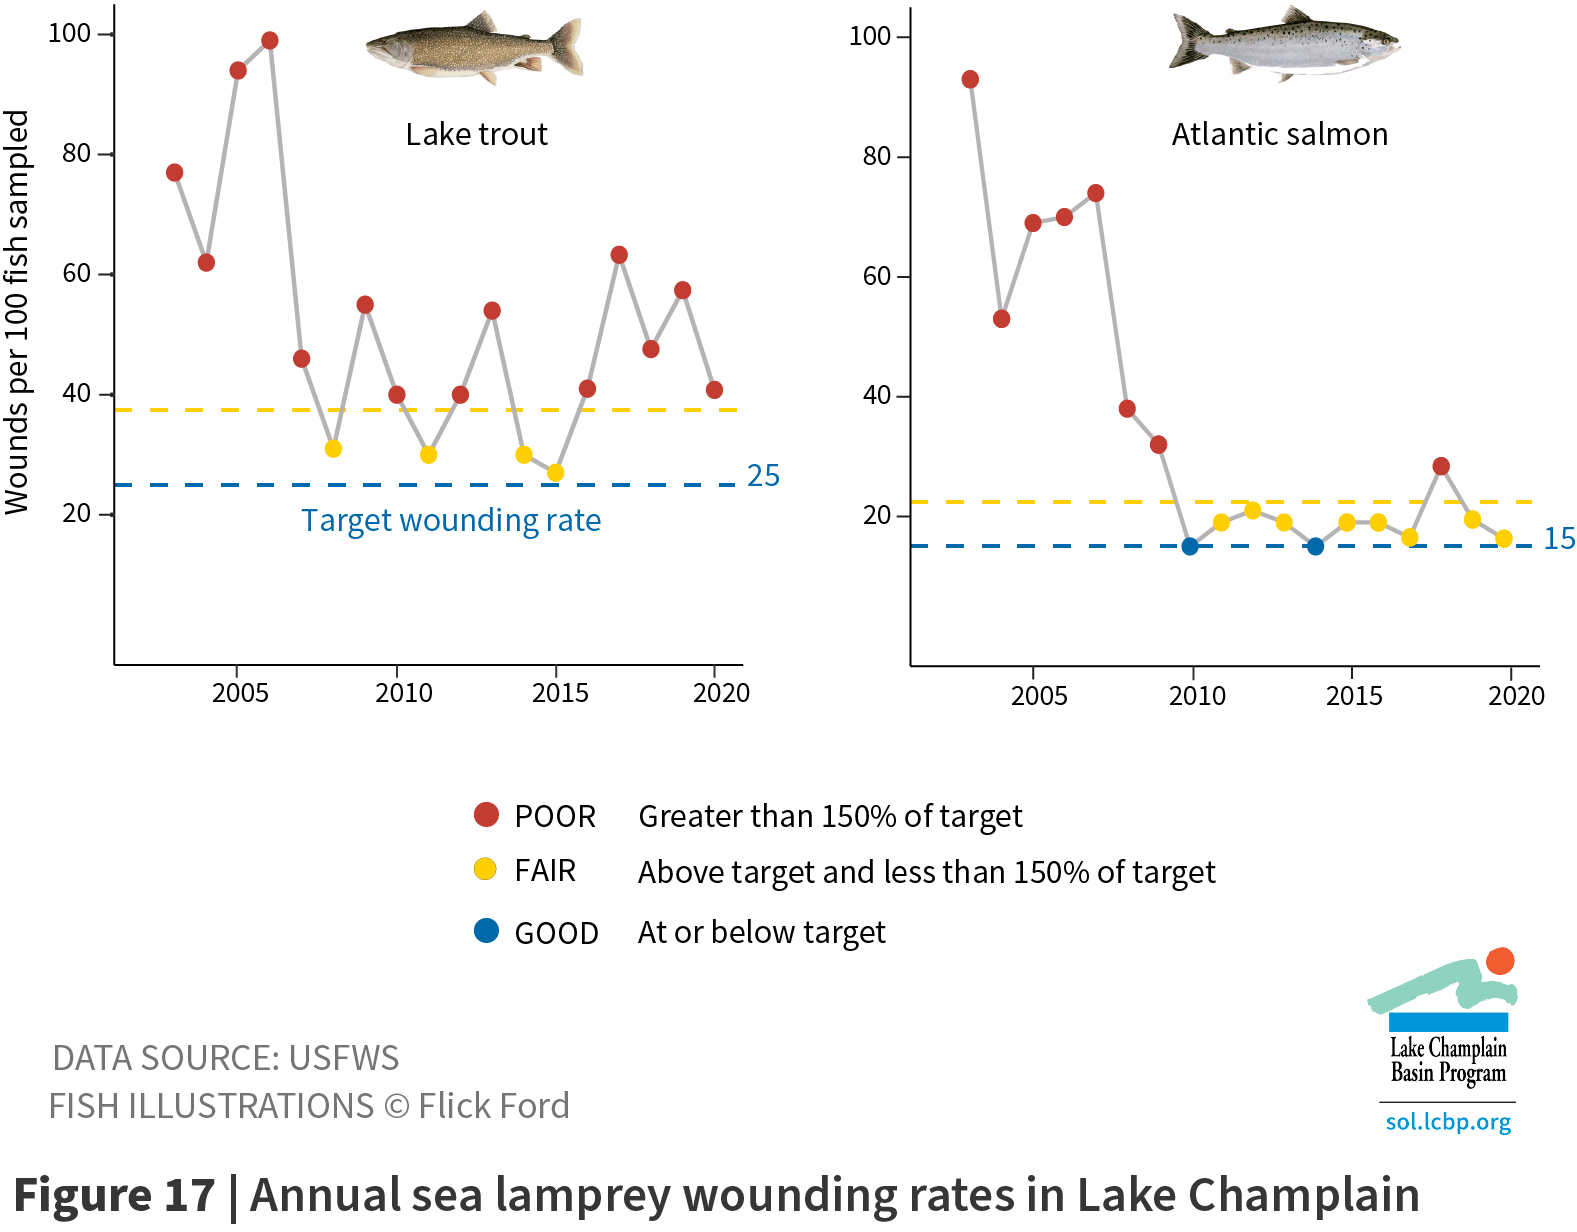
Figure 17
Annual sea lamprey wounding rates in Lake Champlain
Download >>
Figure 18
Waterbodies with aquatic invasive species visited prior to launch into Lake Champlain
Download >>
Figure 19
Invasive water chestnut coverage in Lake Champlain
Download >>
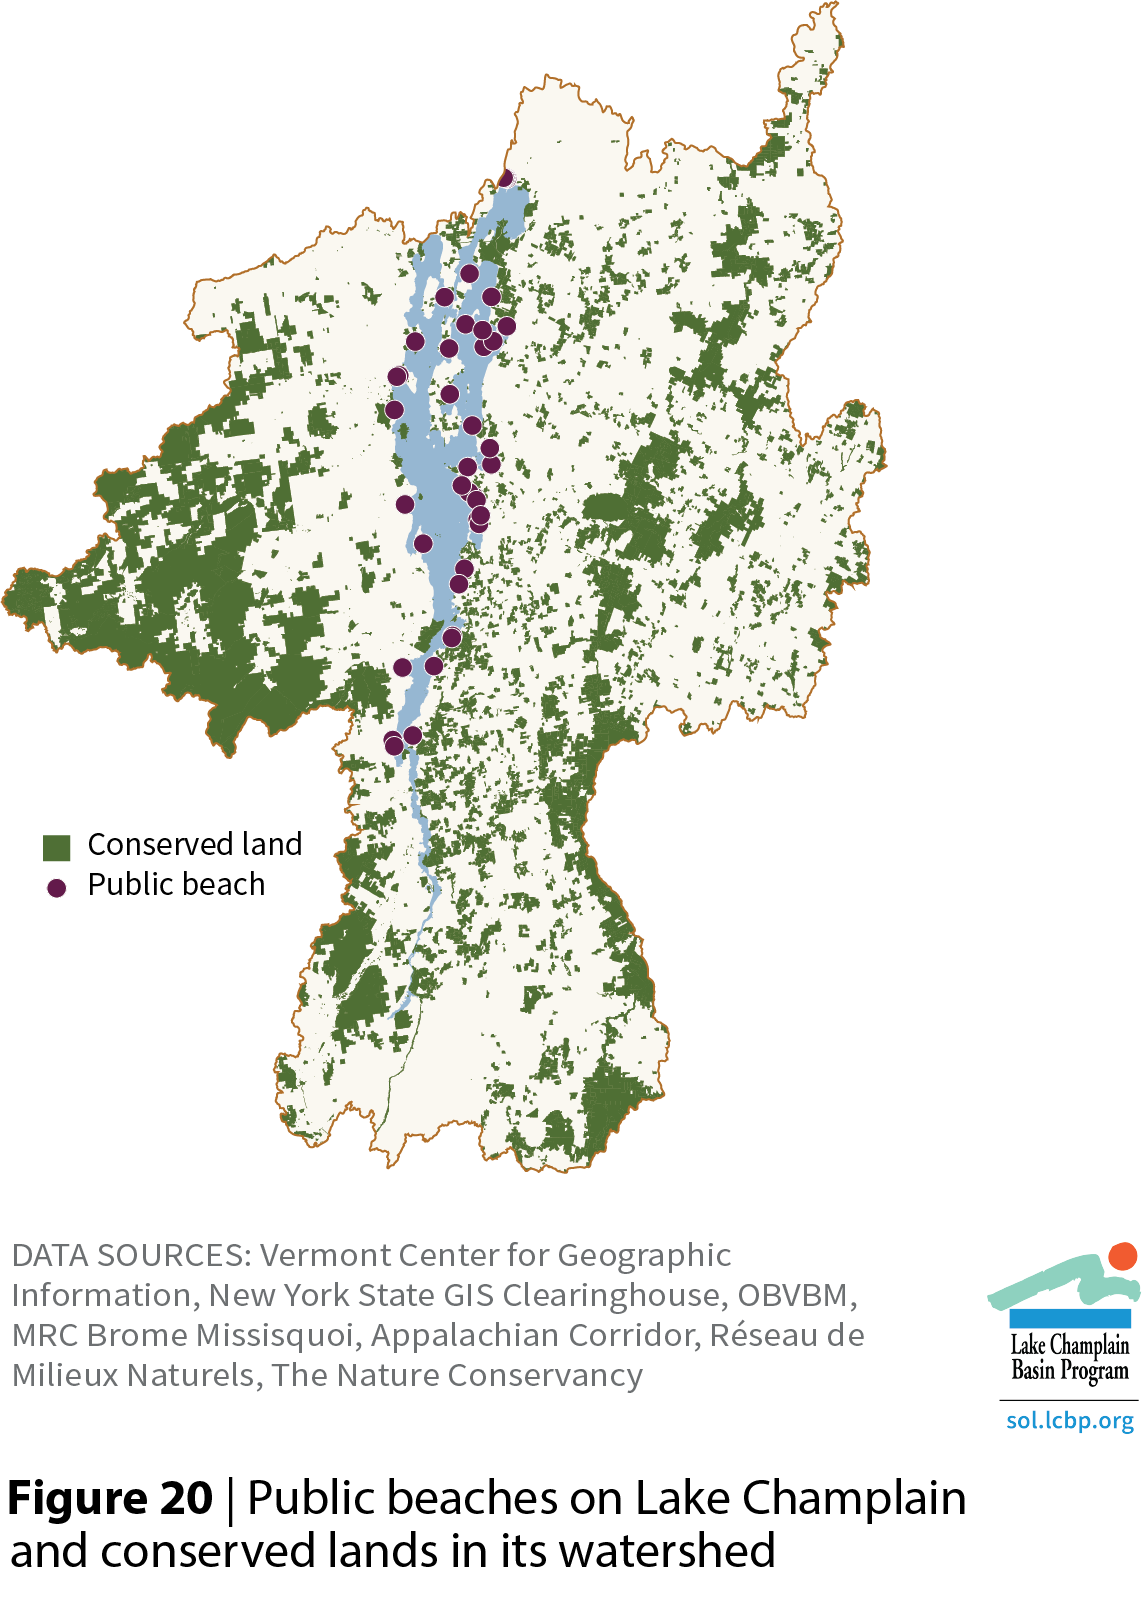
Figure 20
Public beaches on Lake Champlain and conserved lands in its watershed
Download >>
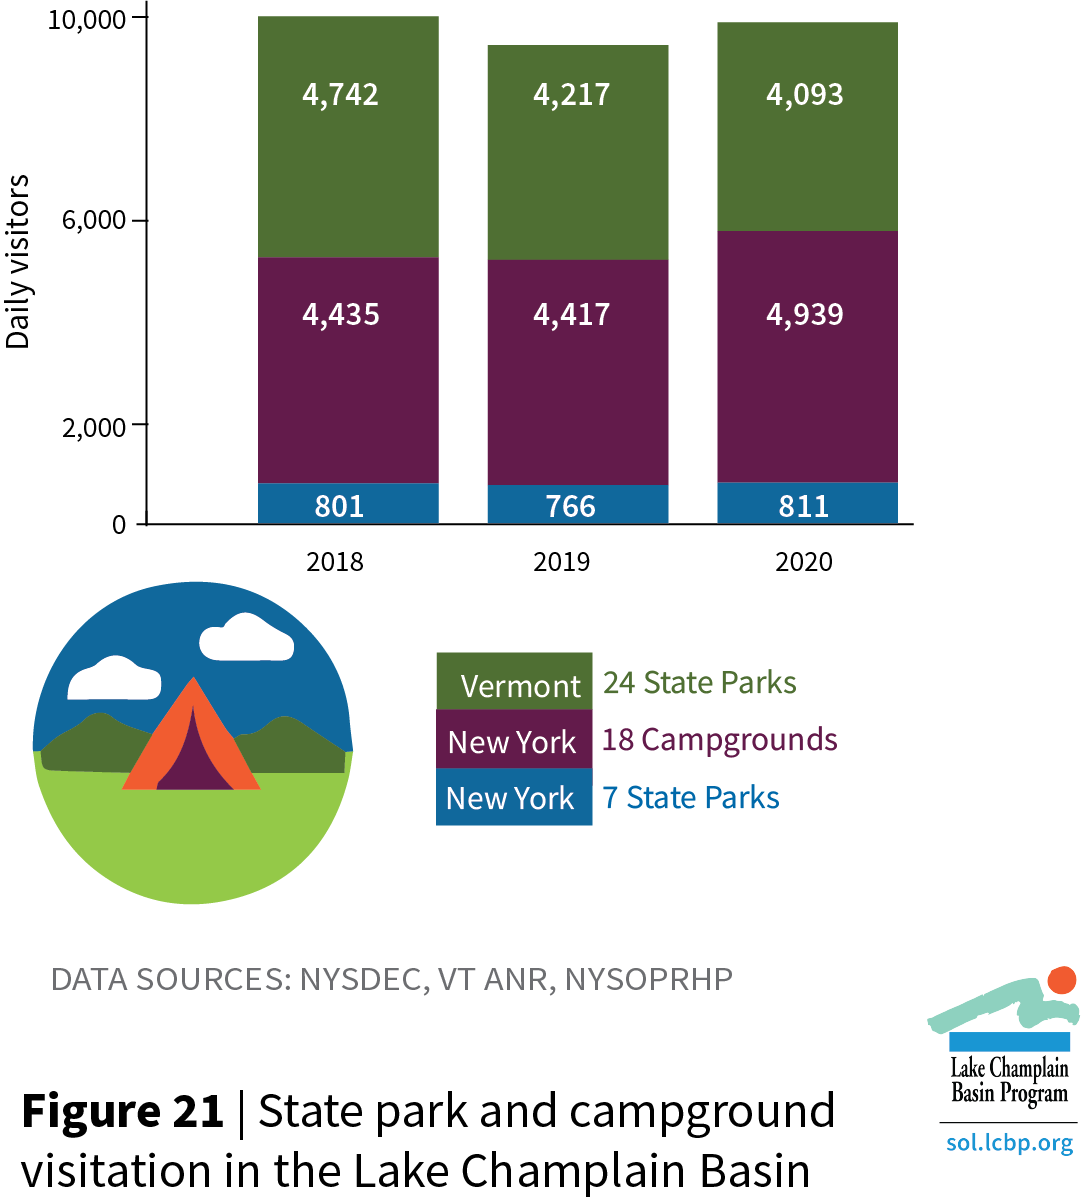
Figure 21
State park and campground visitation in the Lake Champlain Basin
Download >>
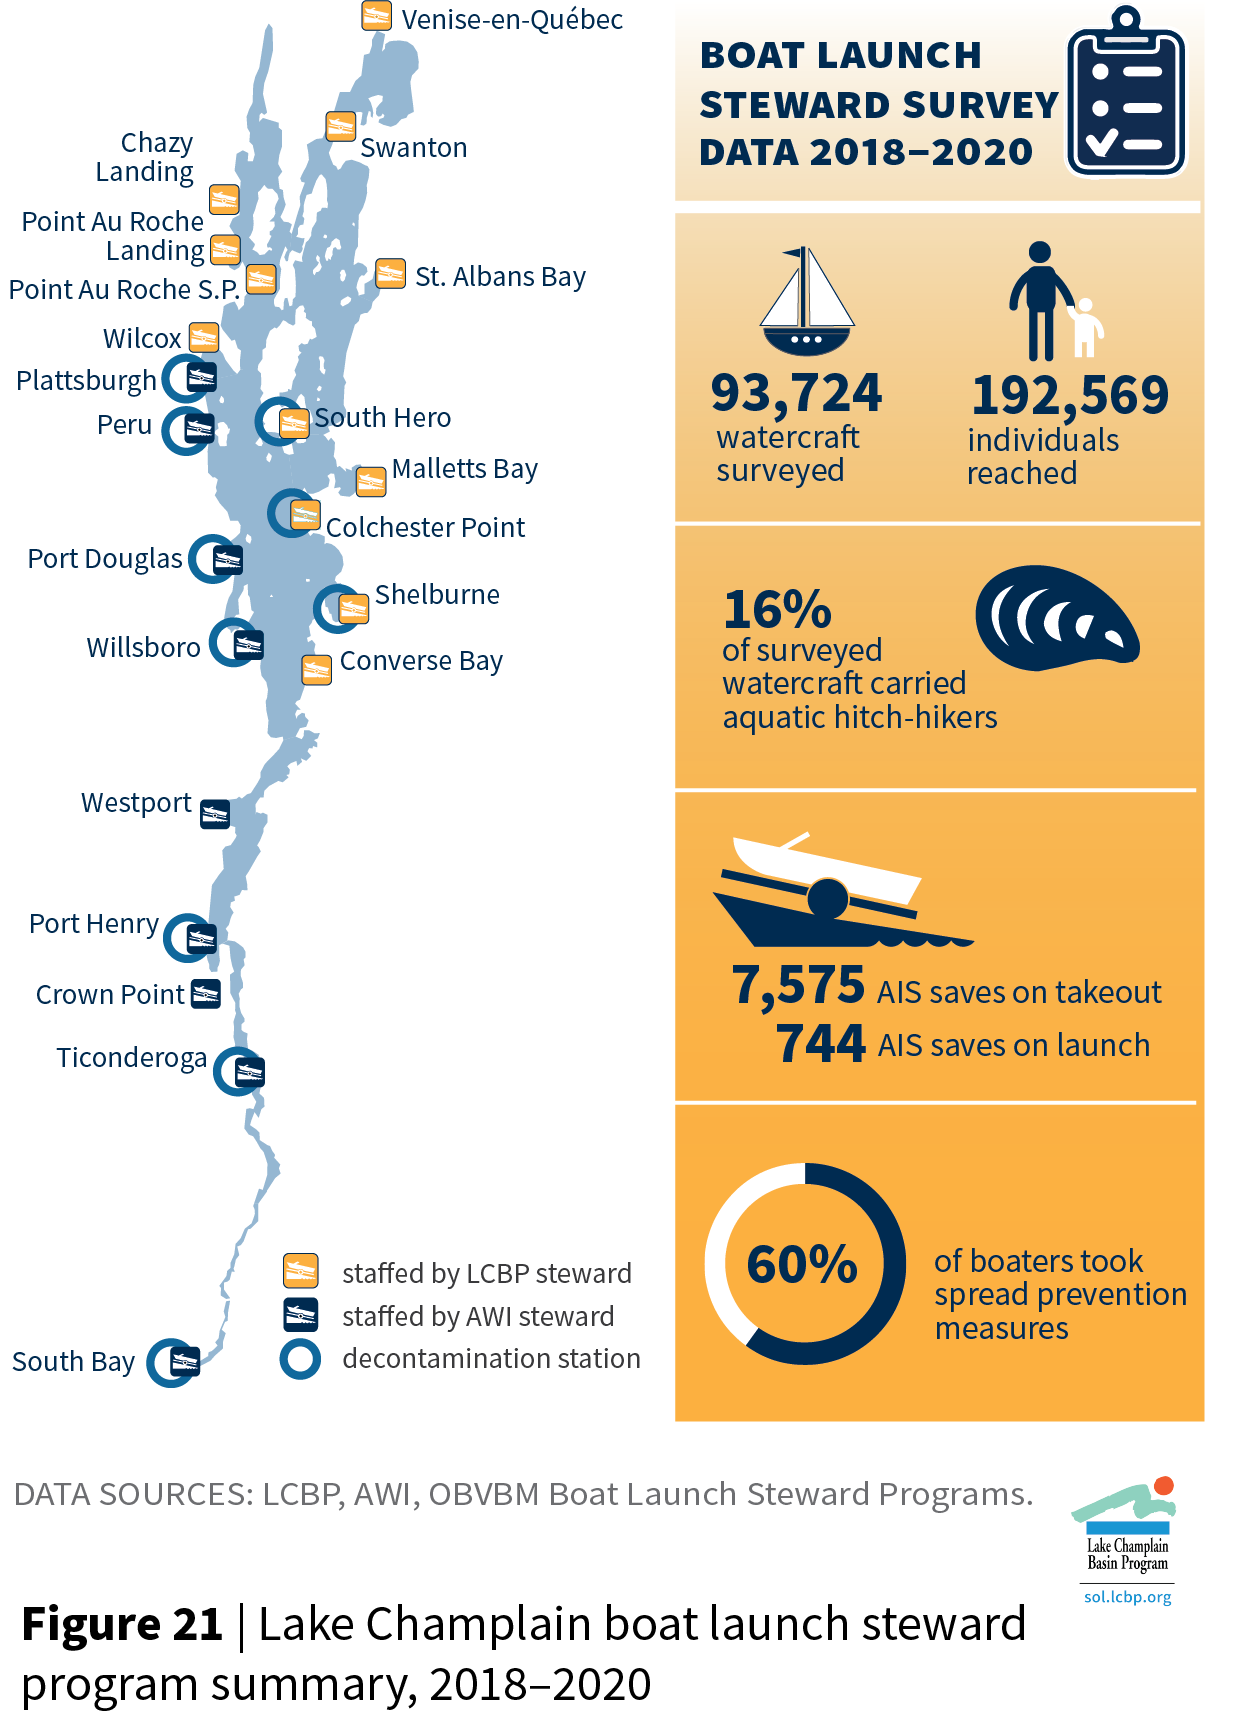
Figure 22
Lake Champlain boat launch steward program summary, 2018–2020
Download >>